Software Engineer
Databases & Data Platforms
Data modeling, SQL, and data platforms: a medallion lakehouse on Databricks with a scheduled pipeline, a PostgreSQL tuning lab where every index is a measured decision and a CI job fails the plan regressions, GA4 site tags taken through BigQuery, PySpark and Airflow to monitored KPIs on Google Cloud, plus mini data marts, KPI marts, ETL/ELT, integrity checks, and pragmatic SQLite/DuckDB workflows.
Back to ProjectsTagline (GA4 Tags to KPIs on Google Cloud)
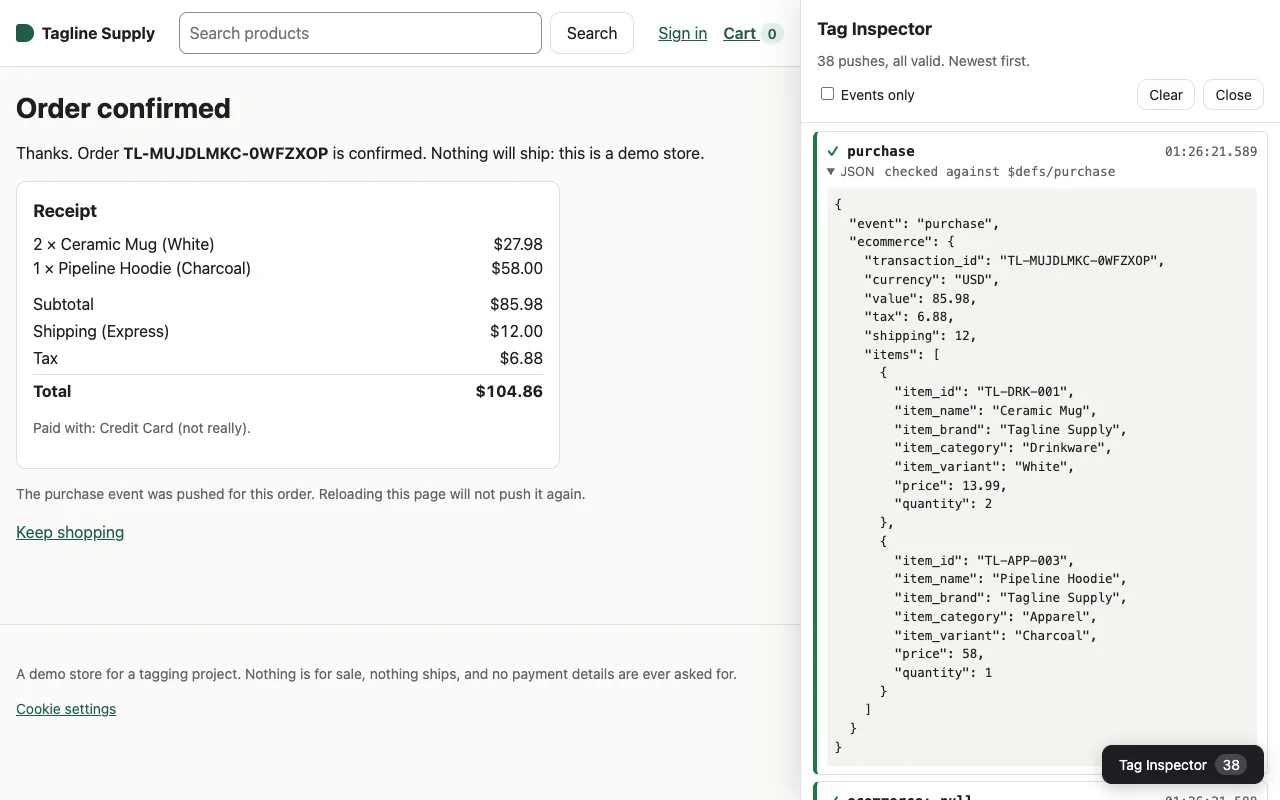
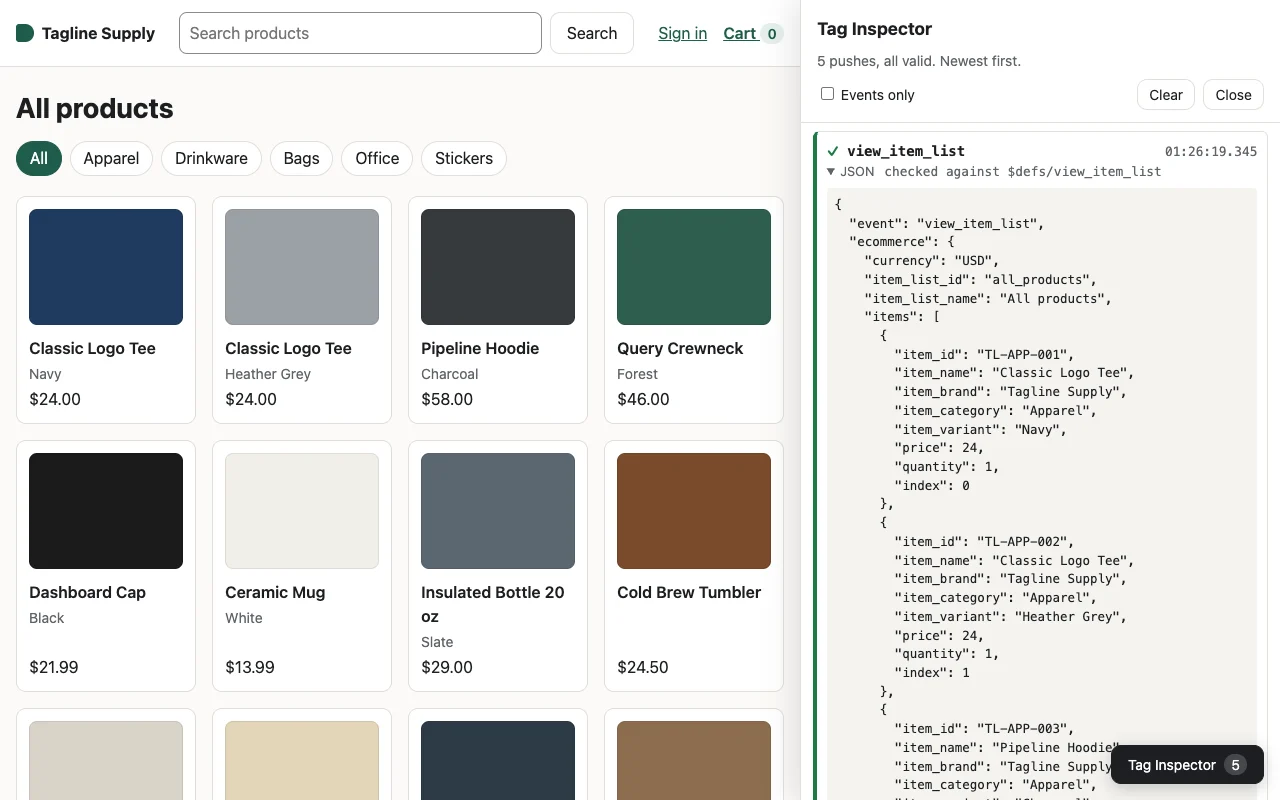
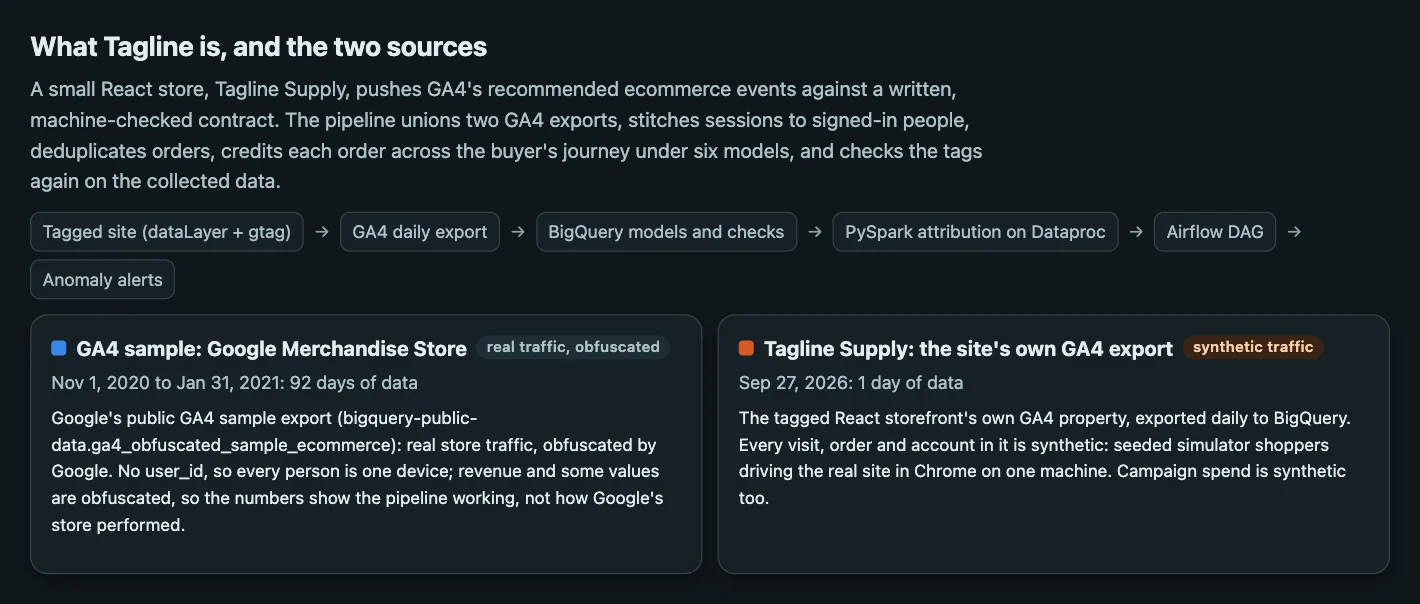
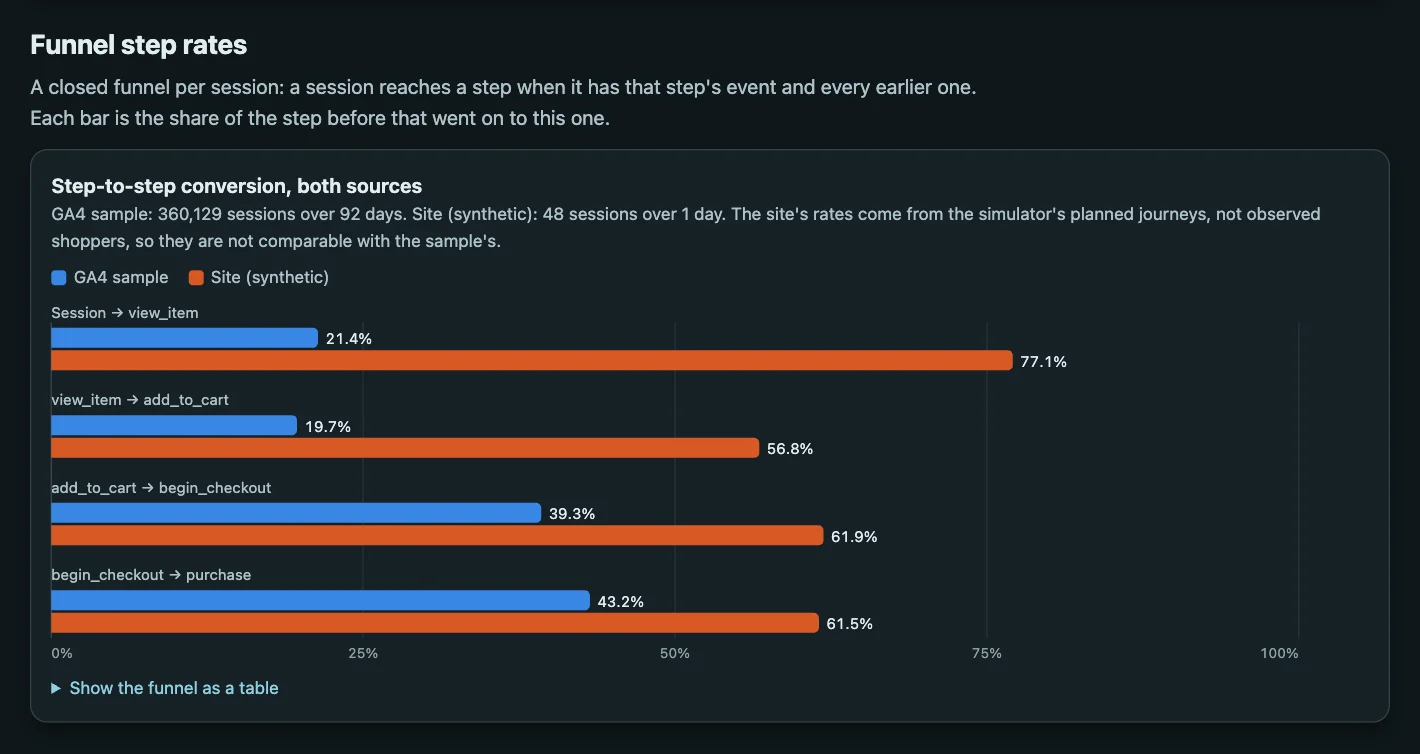
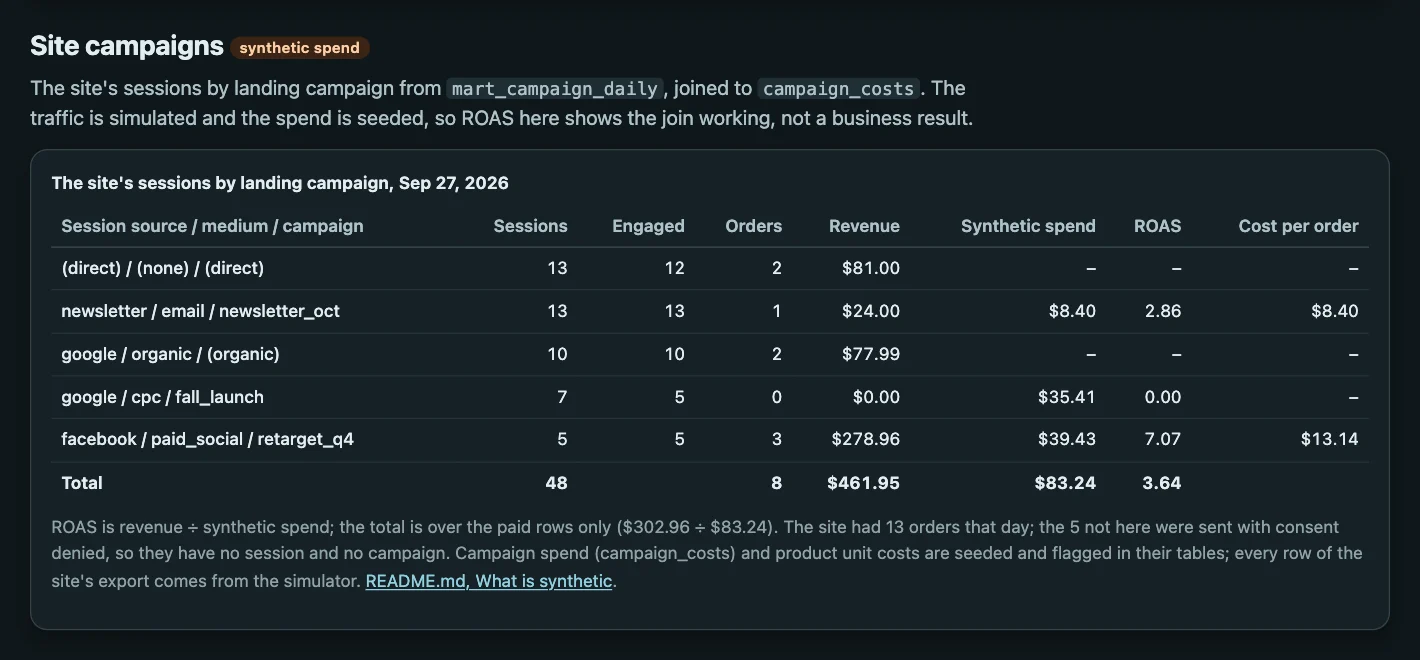
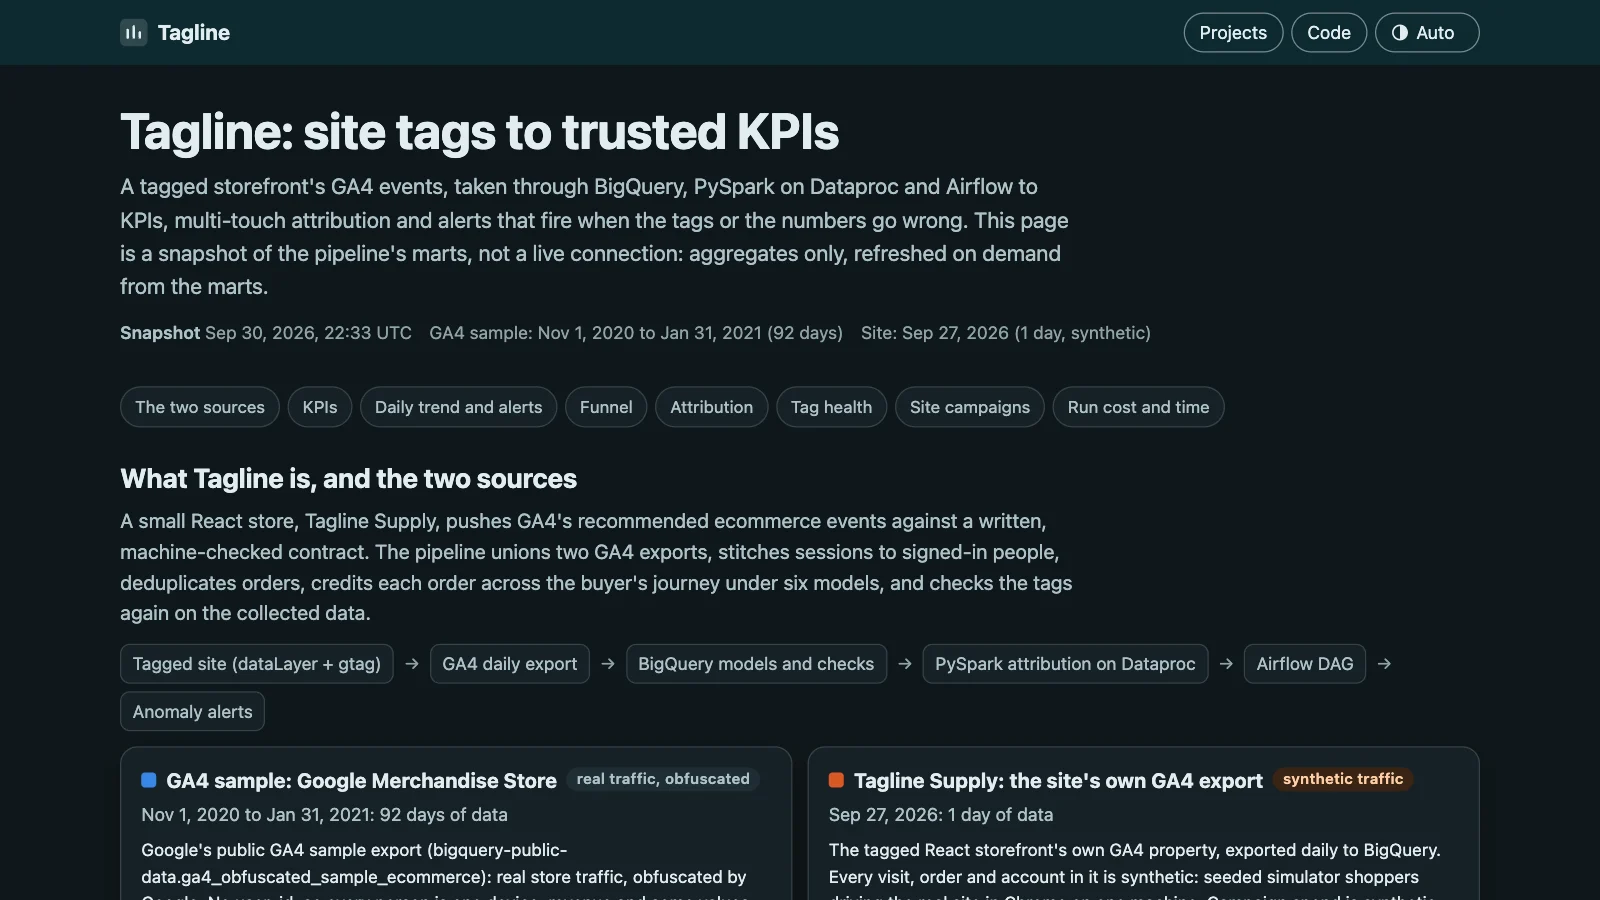
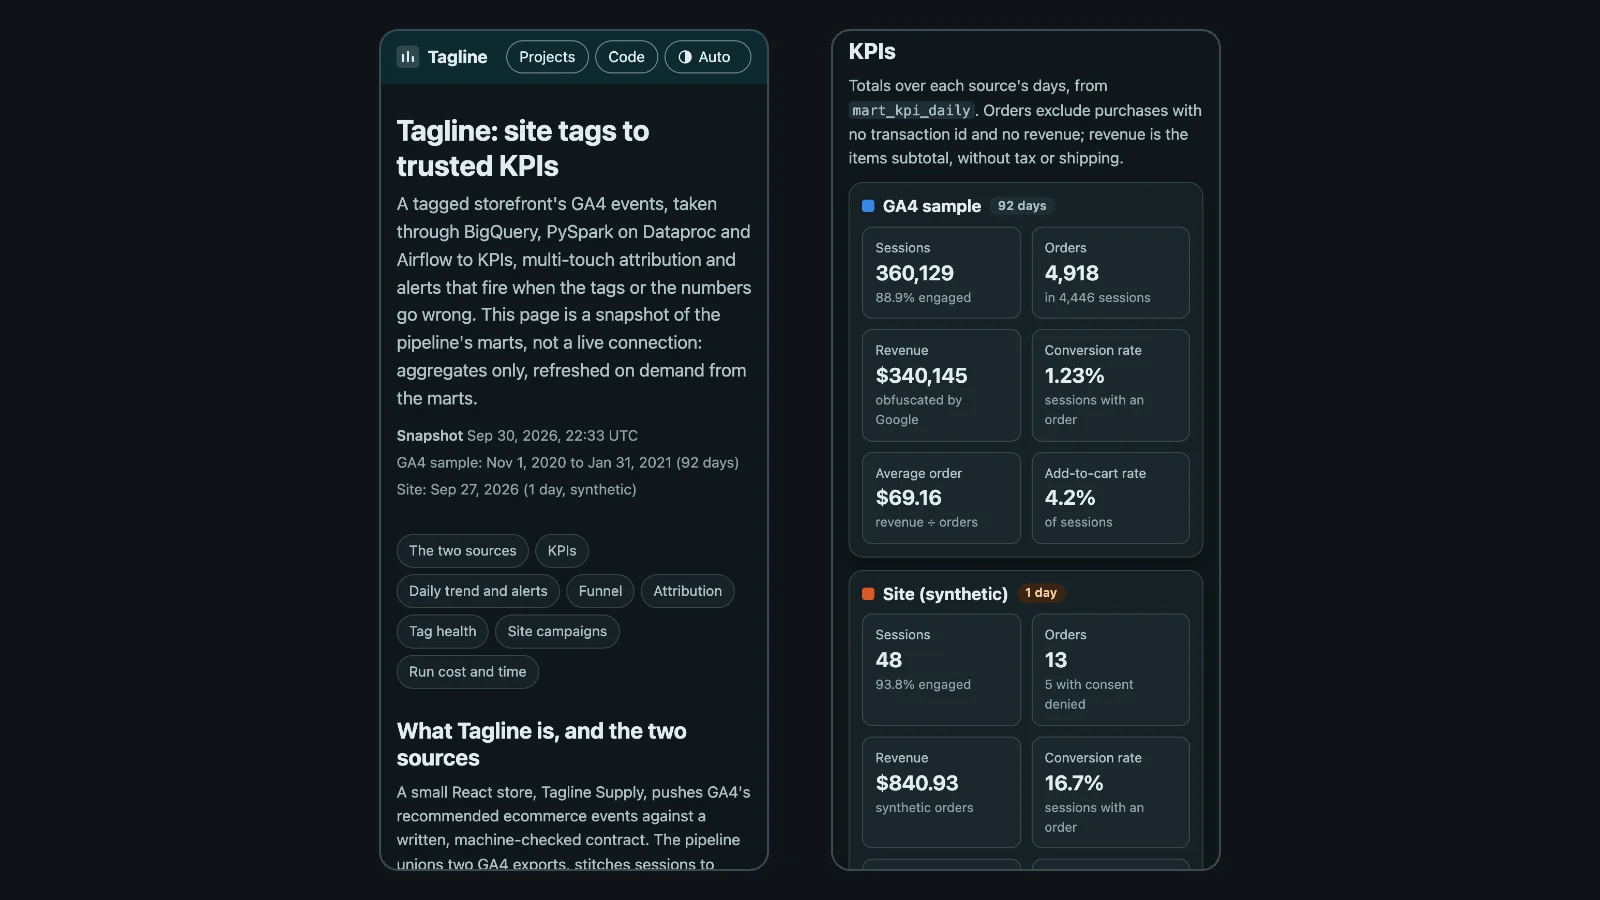
A React storefront tagged with GA4's ecommerce events against a machine-checked contract, and the pipeline behind it: BigQuery over the site's own GA4 export and Google's public GA4 sample, multi-touch attribution in PySpark on Dataproc, one Airflow DAG, measured cost cuts, tag QA and KPI alerts. The site's traffic is simulated, and labelled as such everywhere.
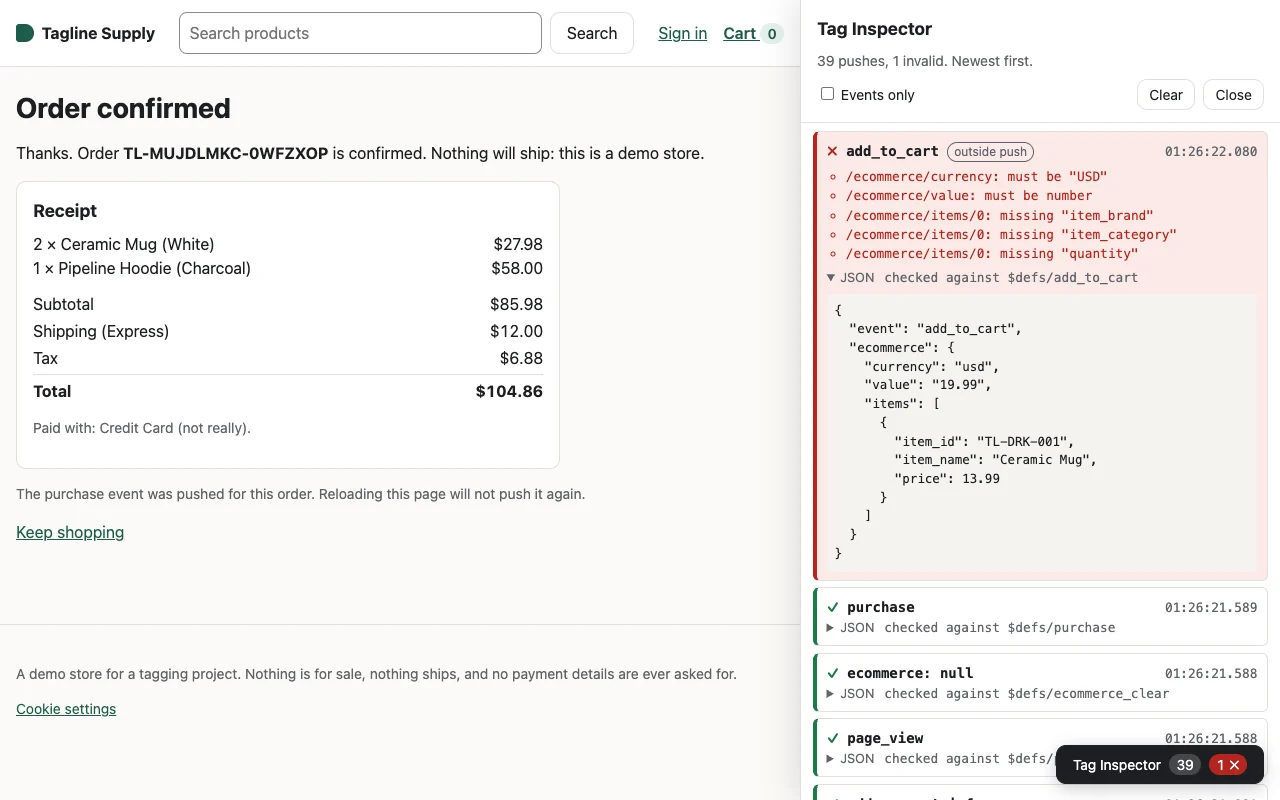
- Stage 1: Tag the site — 14 events validated against a JSON Schema contract as they fire, shown in a Tag Inspector;
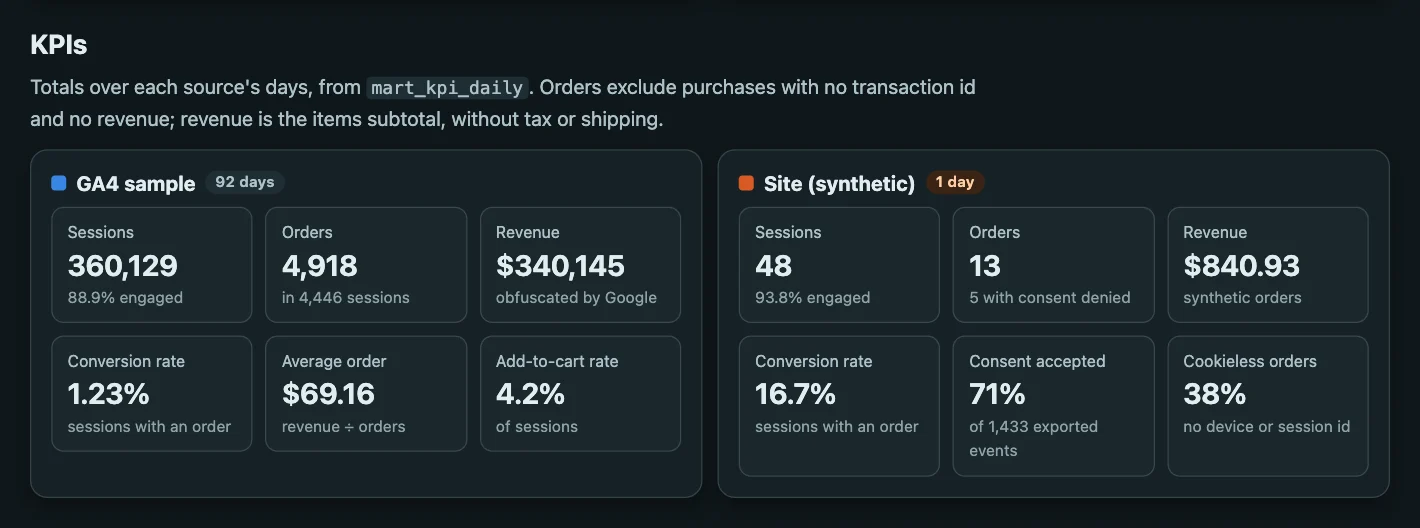
user_idis an opaque account id, never the email. 67 unit tests and a Playwright funnel test. - Stage 2: Stitch and enrich in BigQuery — 4.3 million sample events into 360,129 sessions and 4,918 orders that count as conversions; without the
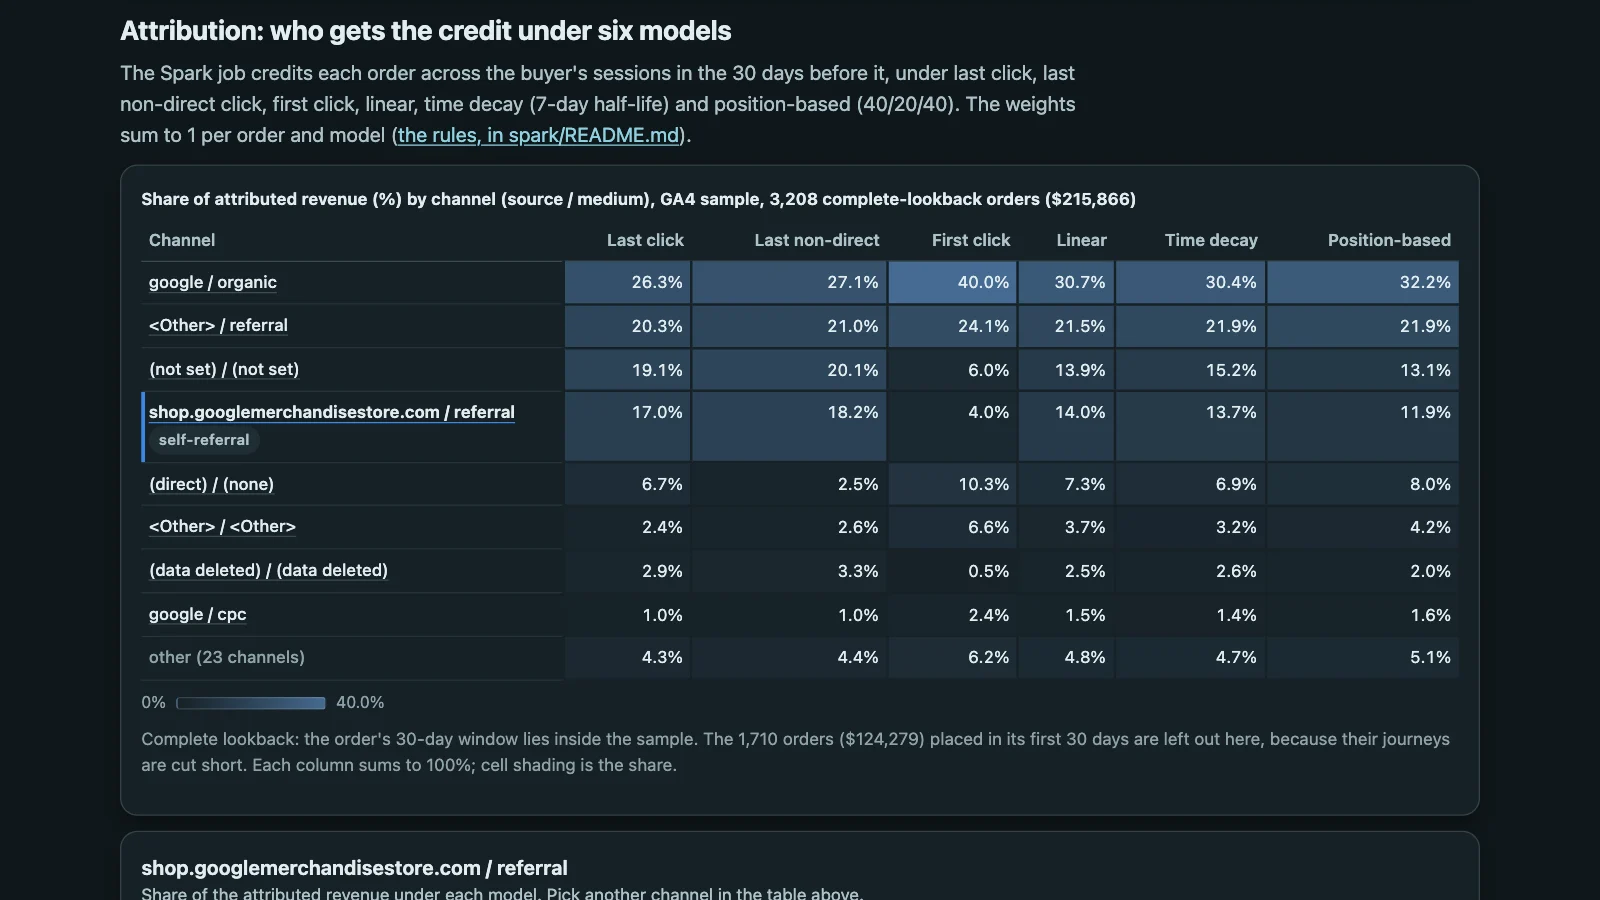
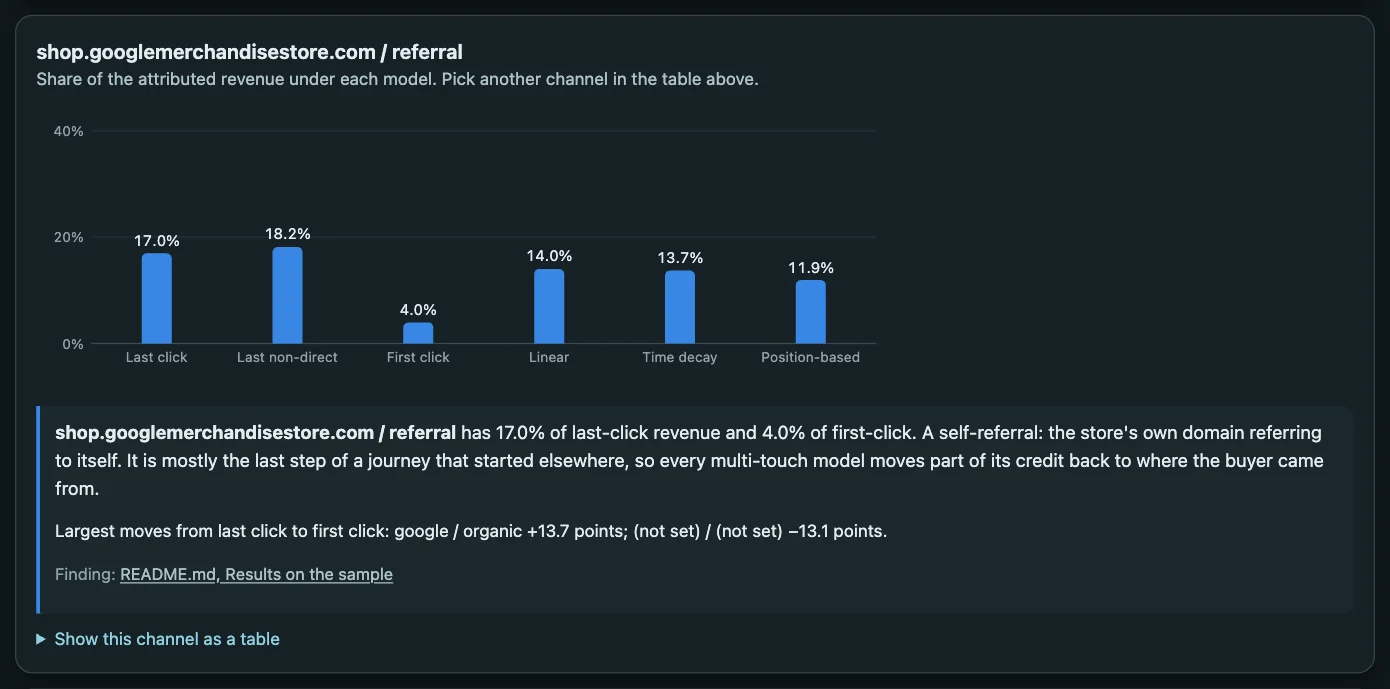
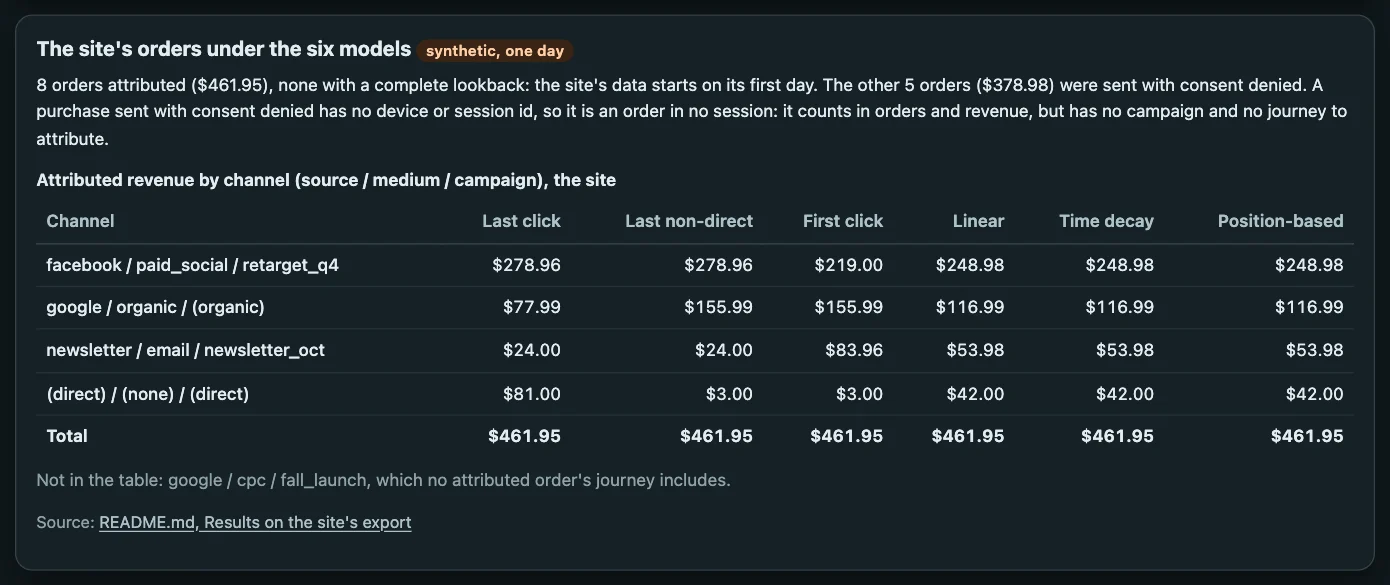
transaction_iddedupe, revenue reads 6.5% high. On the site's export, 8 people stitched across 17 devices. - Stage 3: Attribution in PySpark on Dataproc, run by Airflow — every order credited under six models, reconciling to the cent; the store's self-referral falls from 17.0% of last-click revenue to 4.0% of first-click (orders with a complete 30-day lookback).
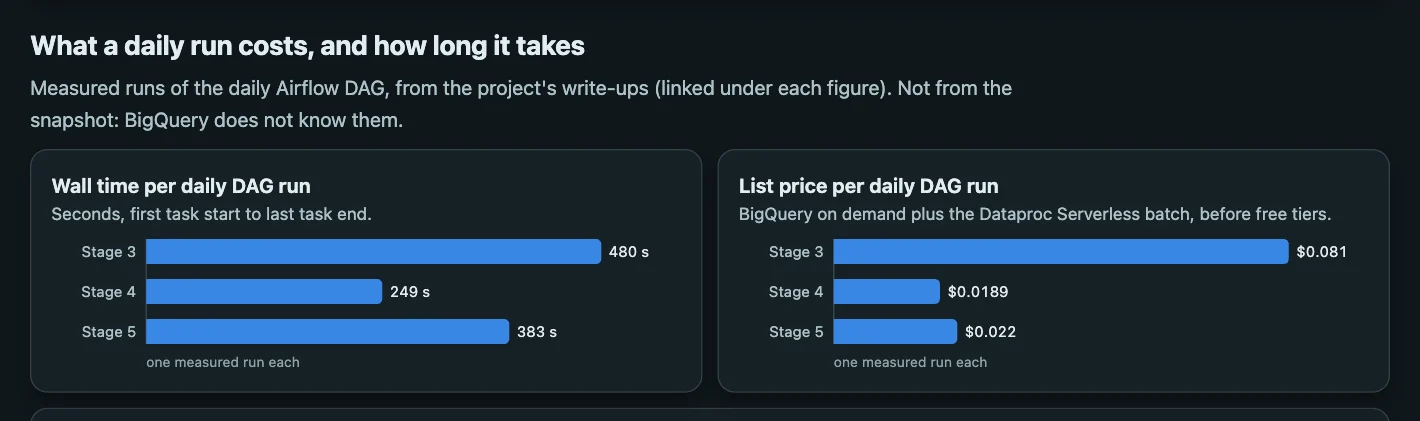
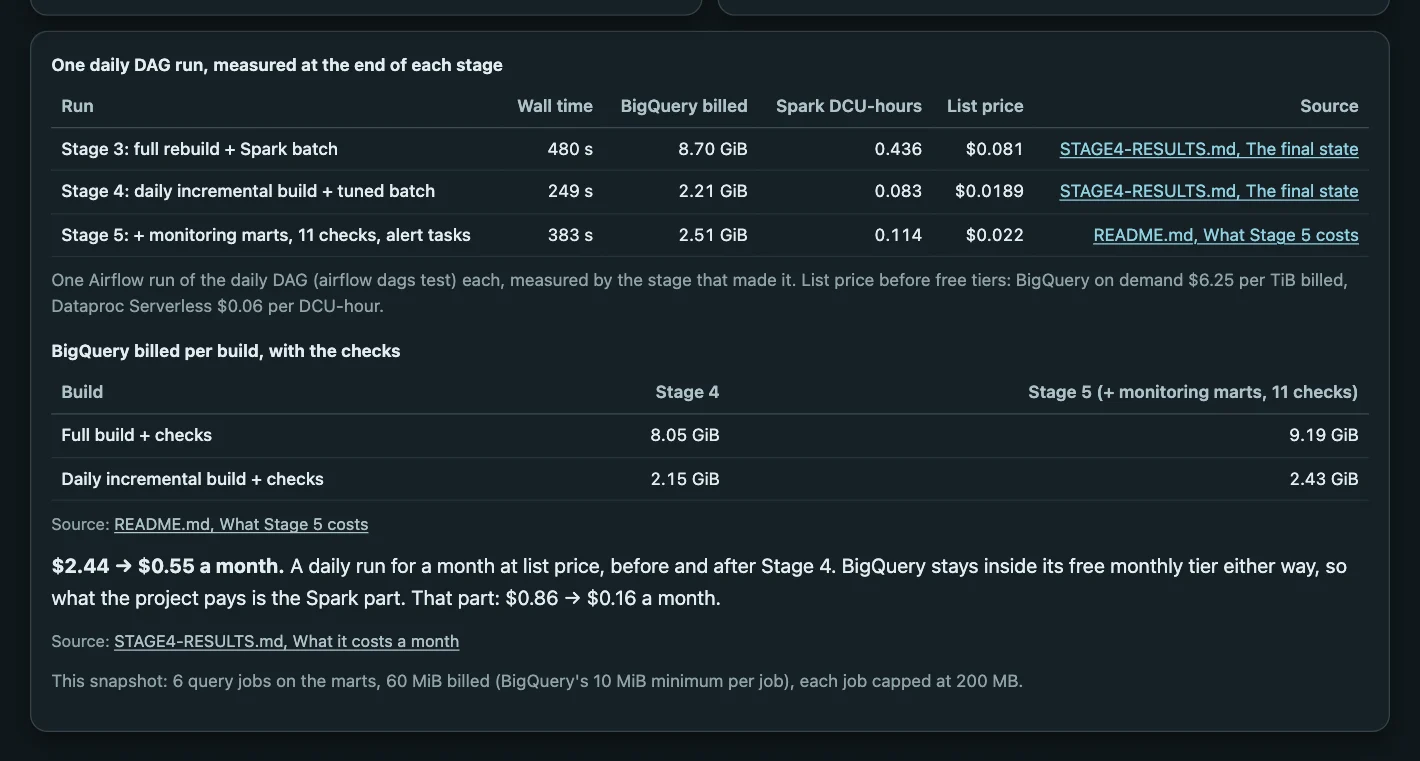
- Stage 4: Cost, measured — nine experiments, each kept or reverted on its numbers: a daily DAG run from 480 s and $0.081 to 249 s and $0.019, BigQuery billing 75% less, outputs unchanged but for two last-bit sums.
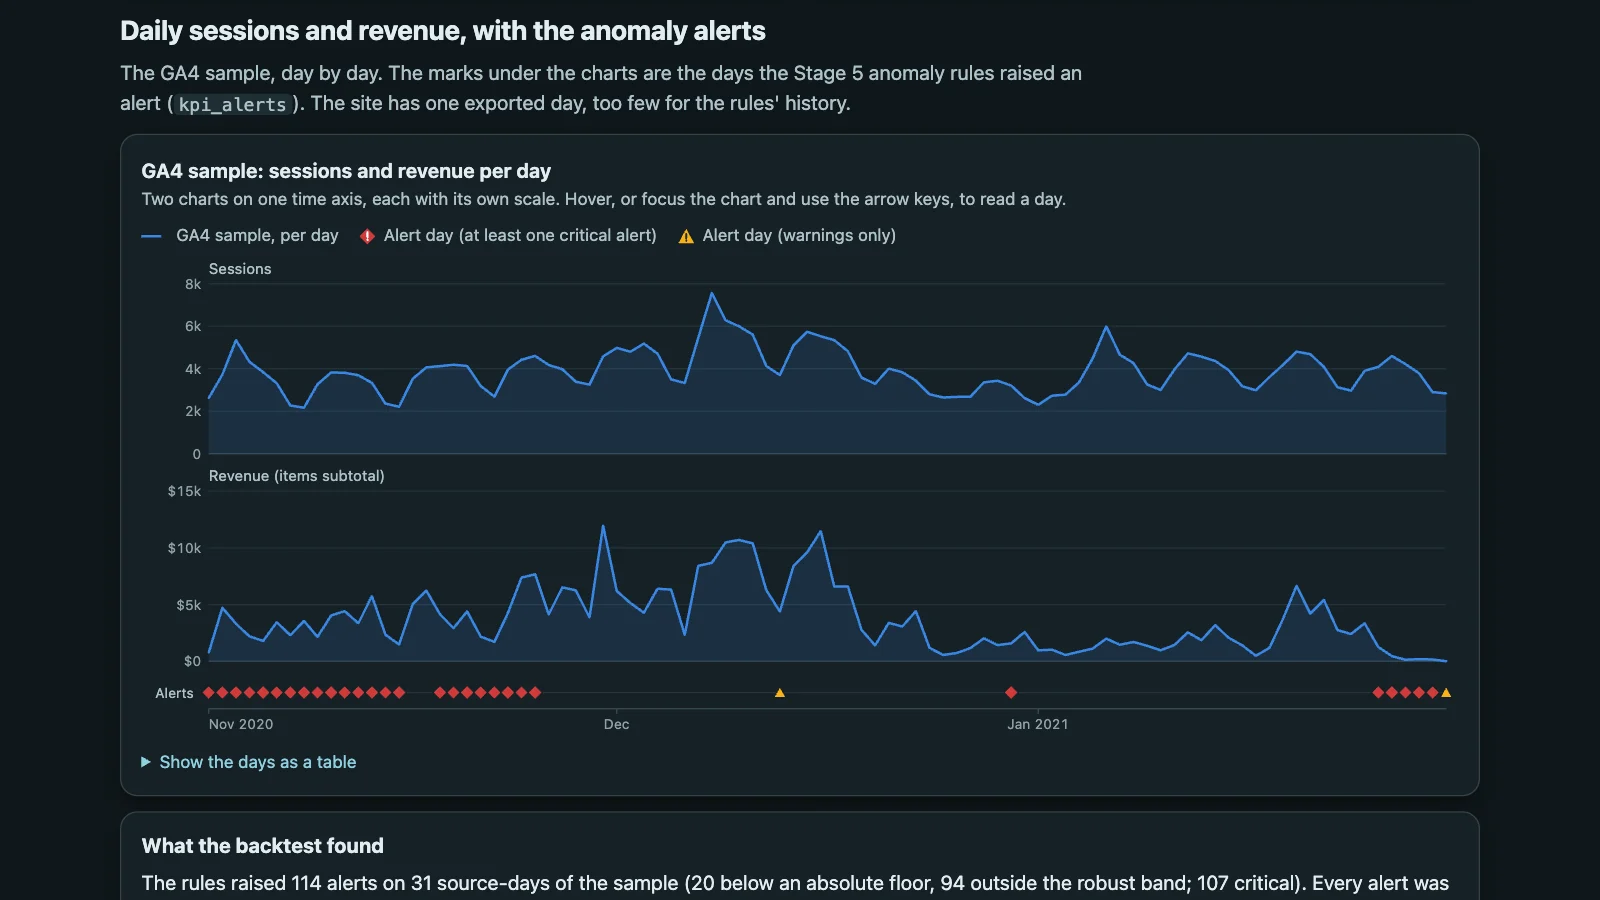
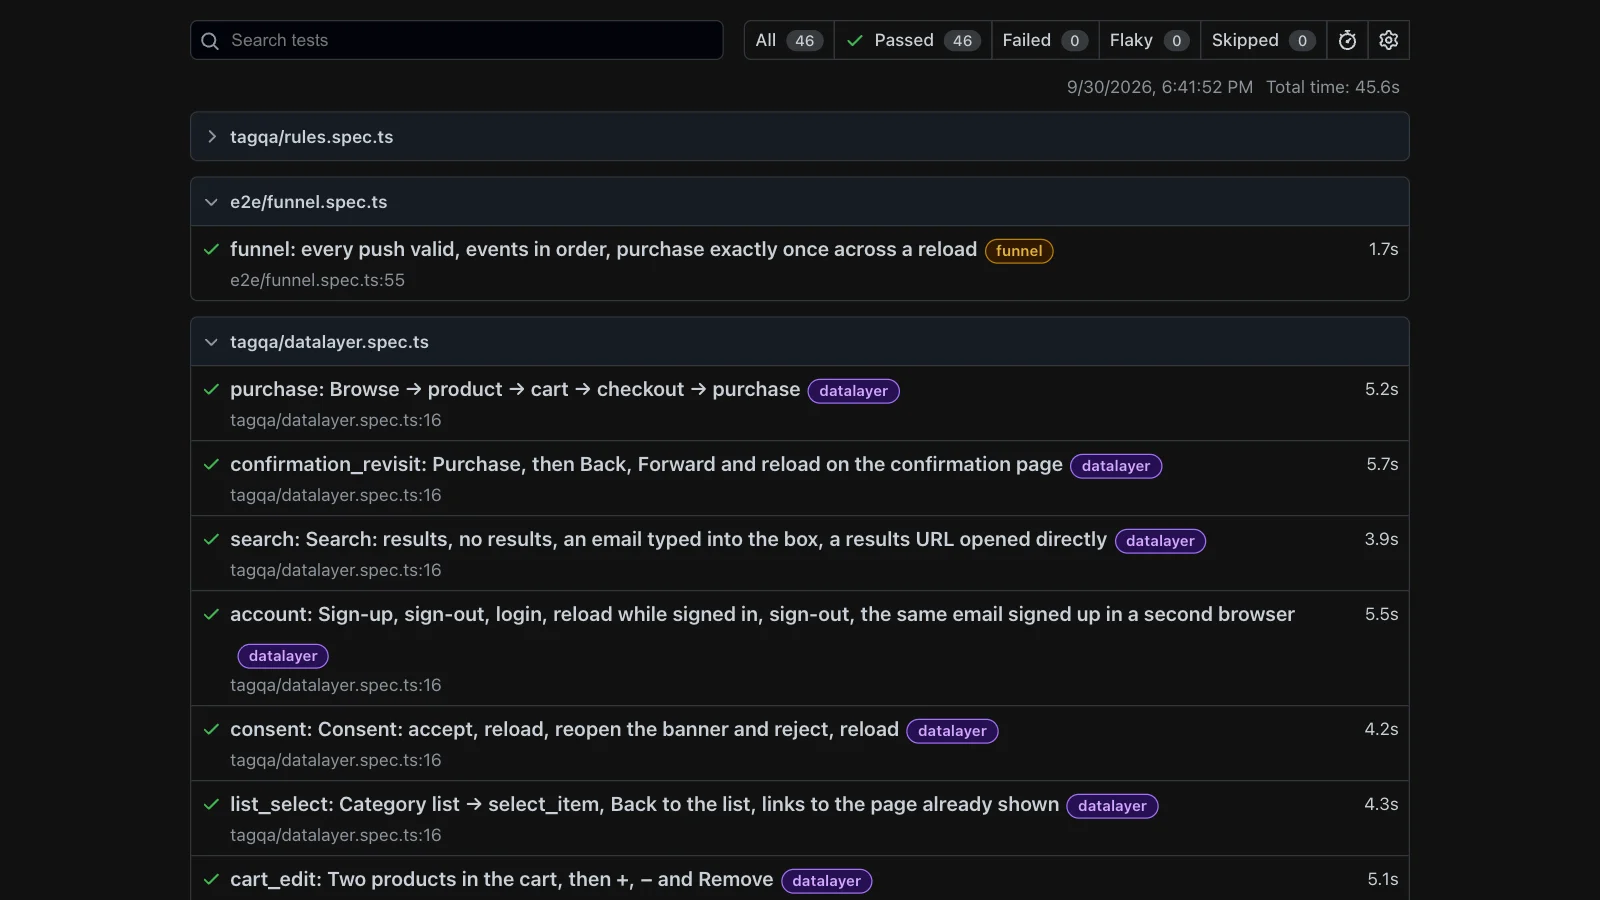
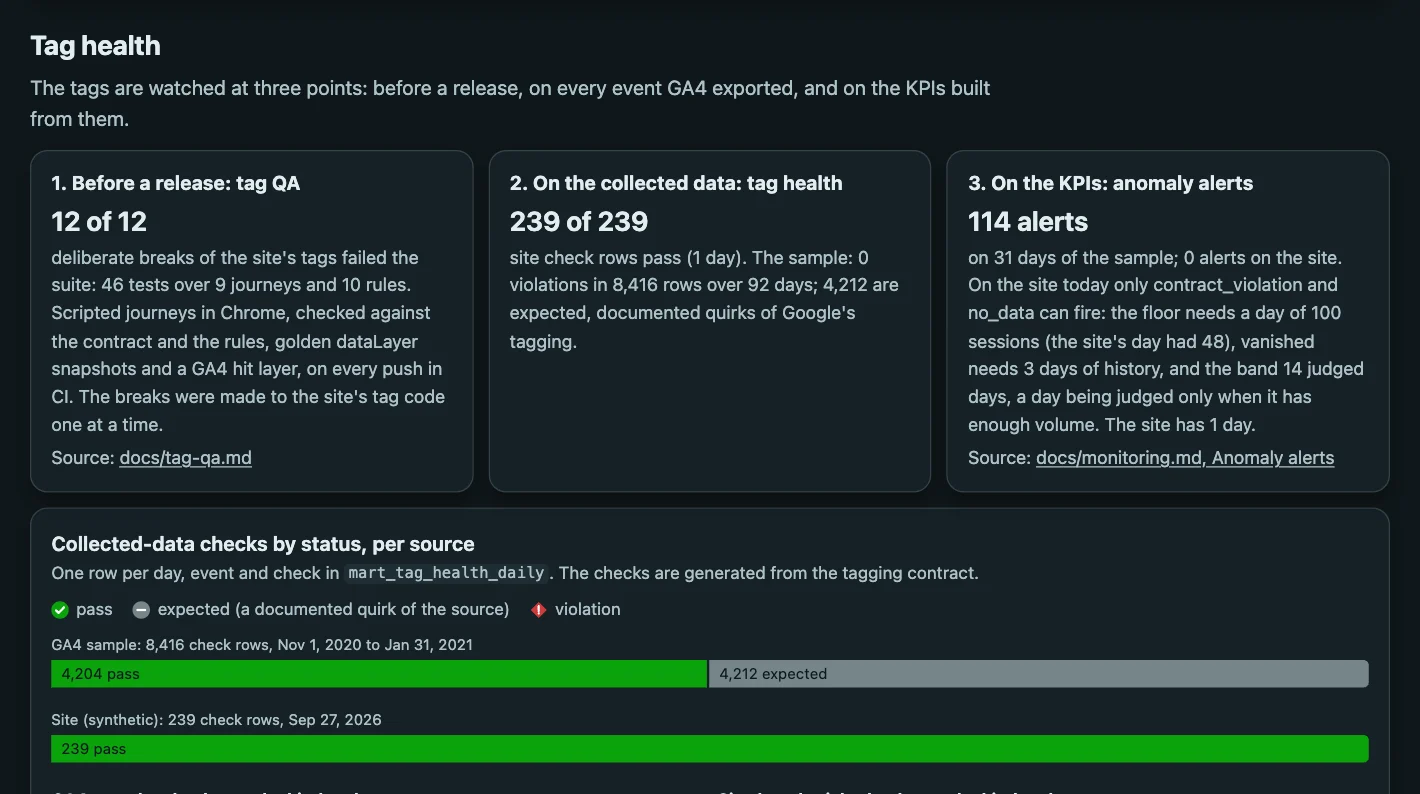
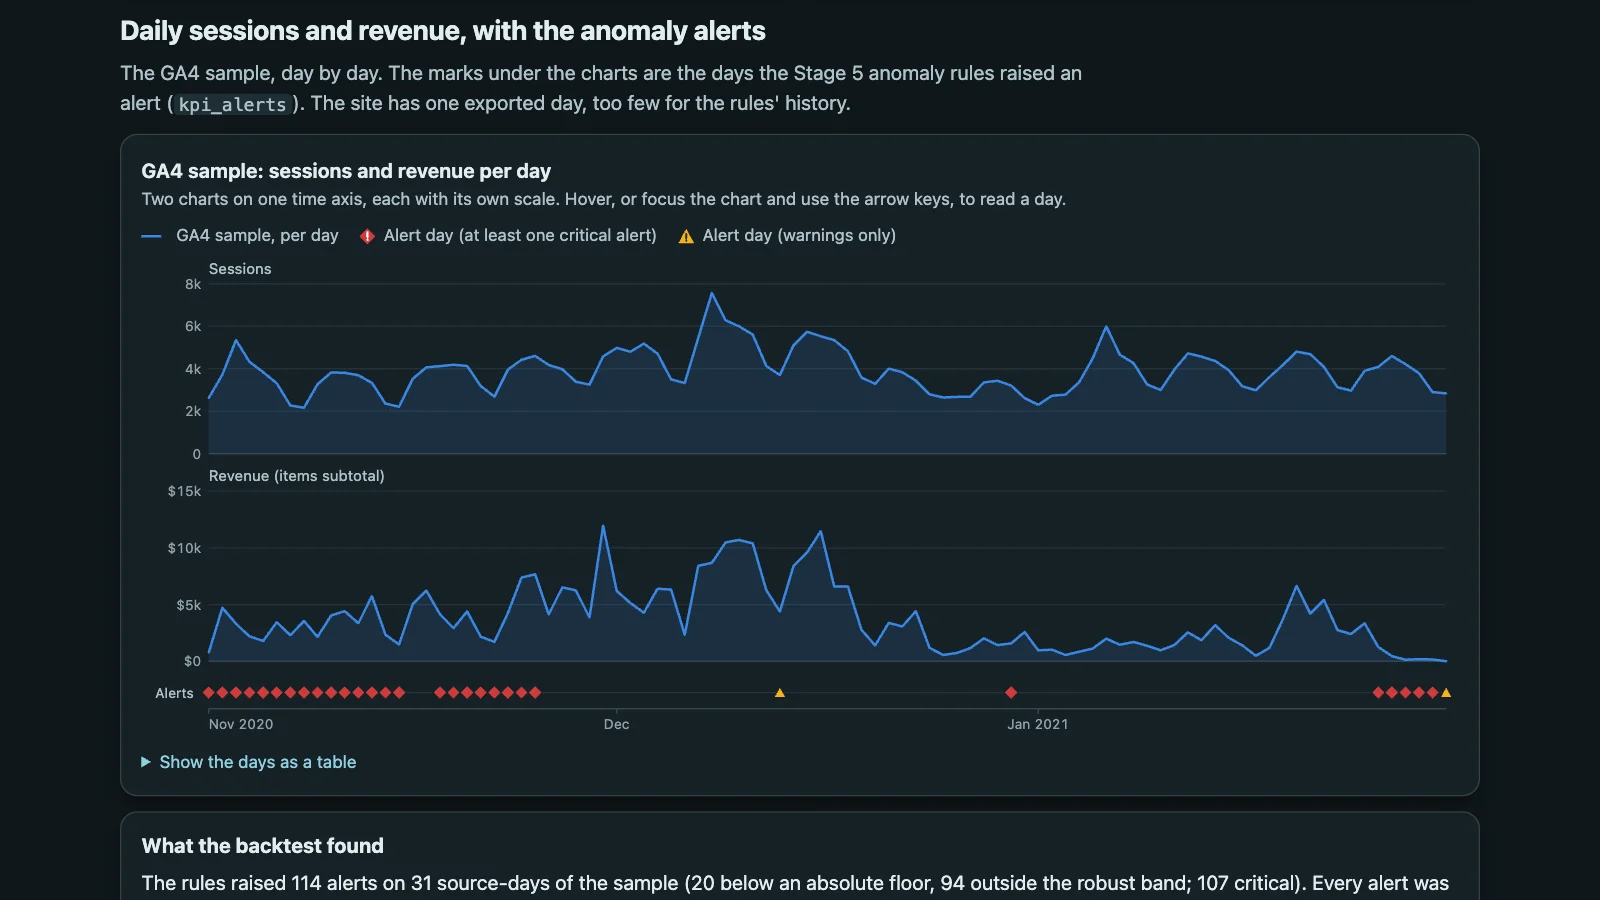
- Stage 5: Guard the data — a 46-test tag QA suite in CI catches 12 of 12 deliberate tag breaks; anomaly alerts backtested on 92 days raised 114 alerts in 12 incidents, all but one traced to six real problems in Google's own data.
- Stage 6: Run it like a product — a RICE-scored roadmap of 26 items traced to Stages 1–5, three GitHub issue forms for intake, a decision log, and a static dashboard over a 71 KB snapshot of the marts.
Review Radar (Databricks Lakehouse)
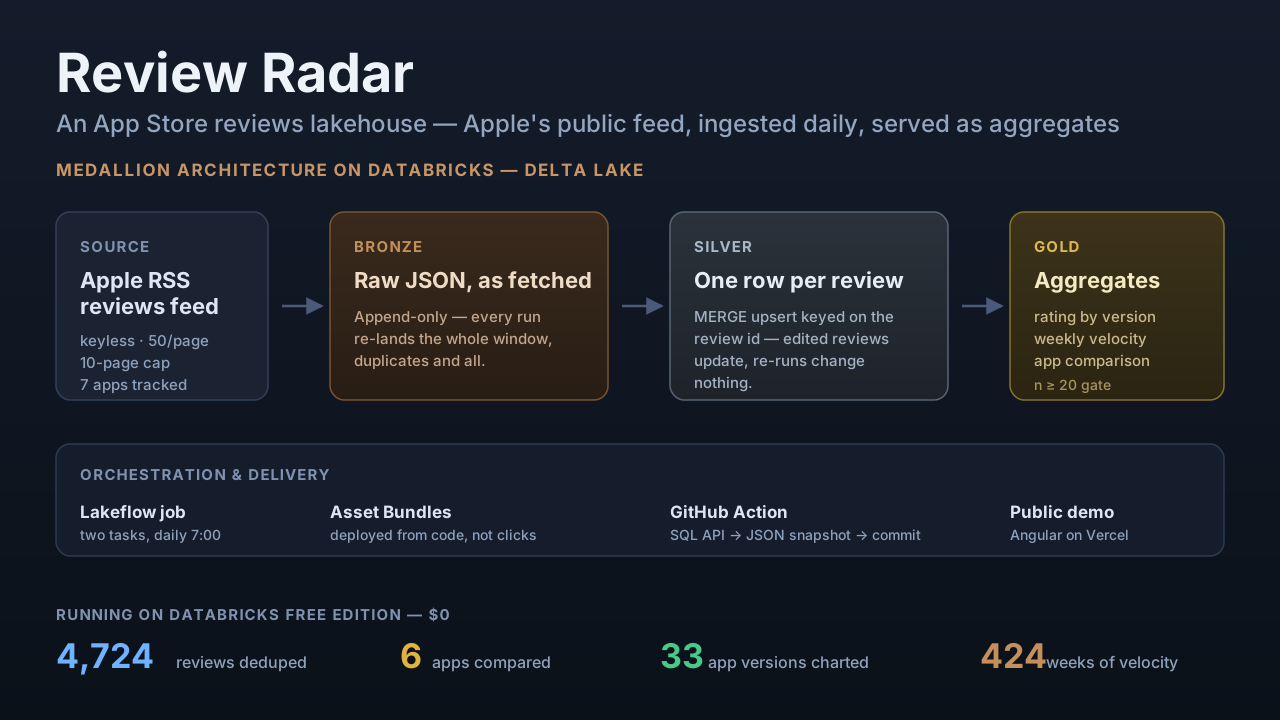
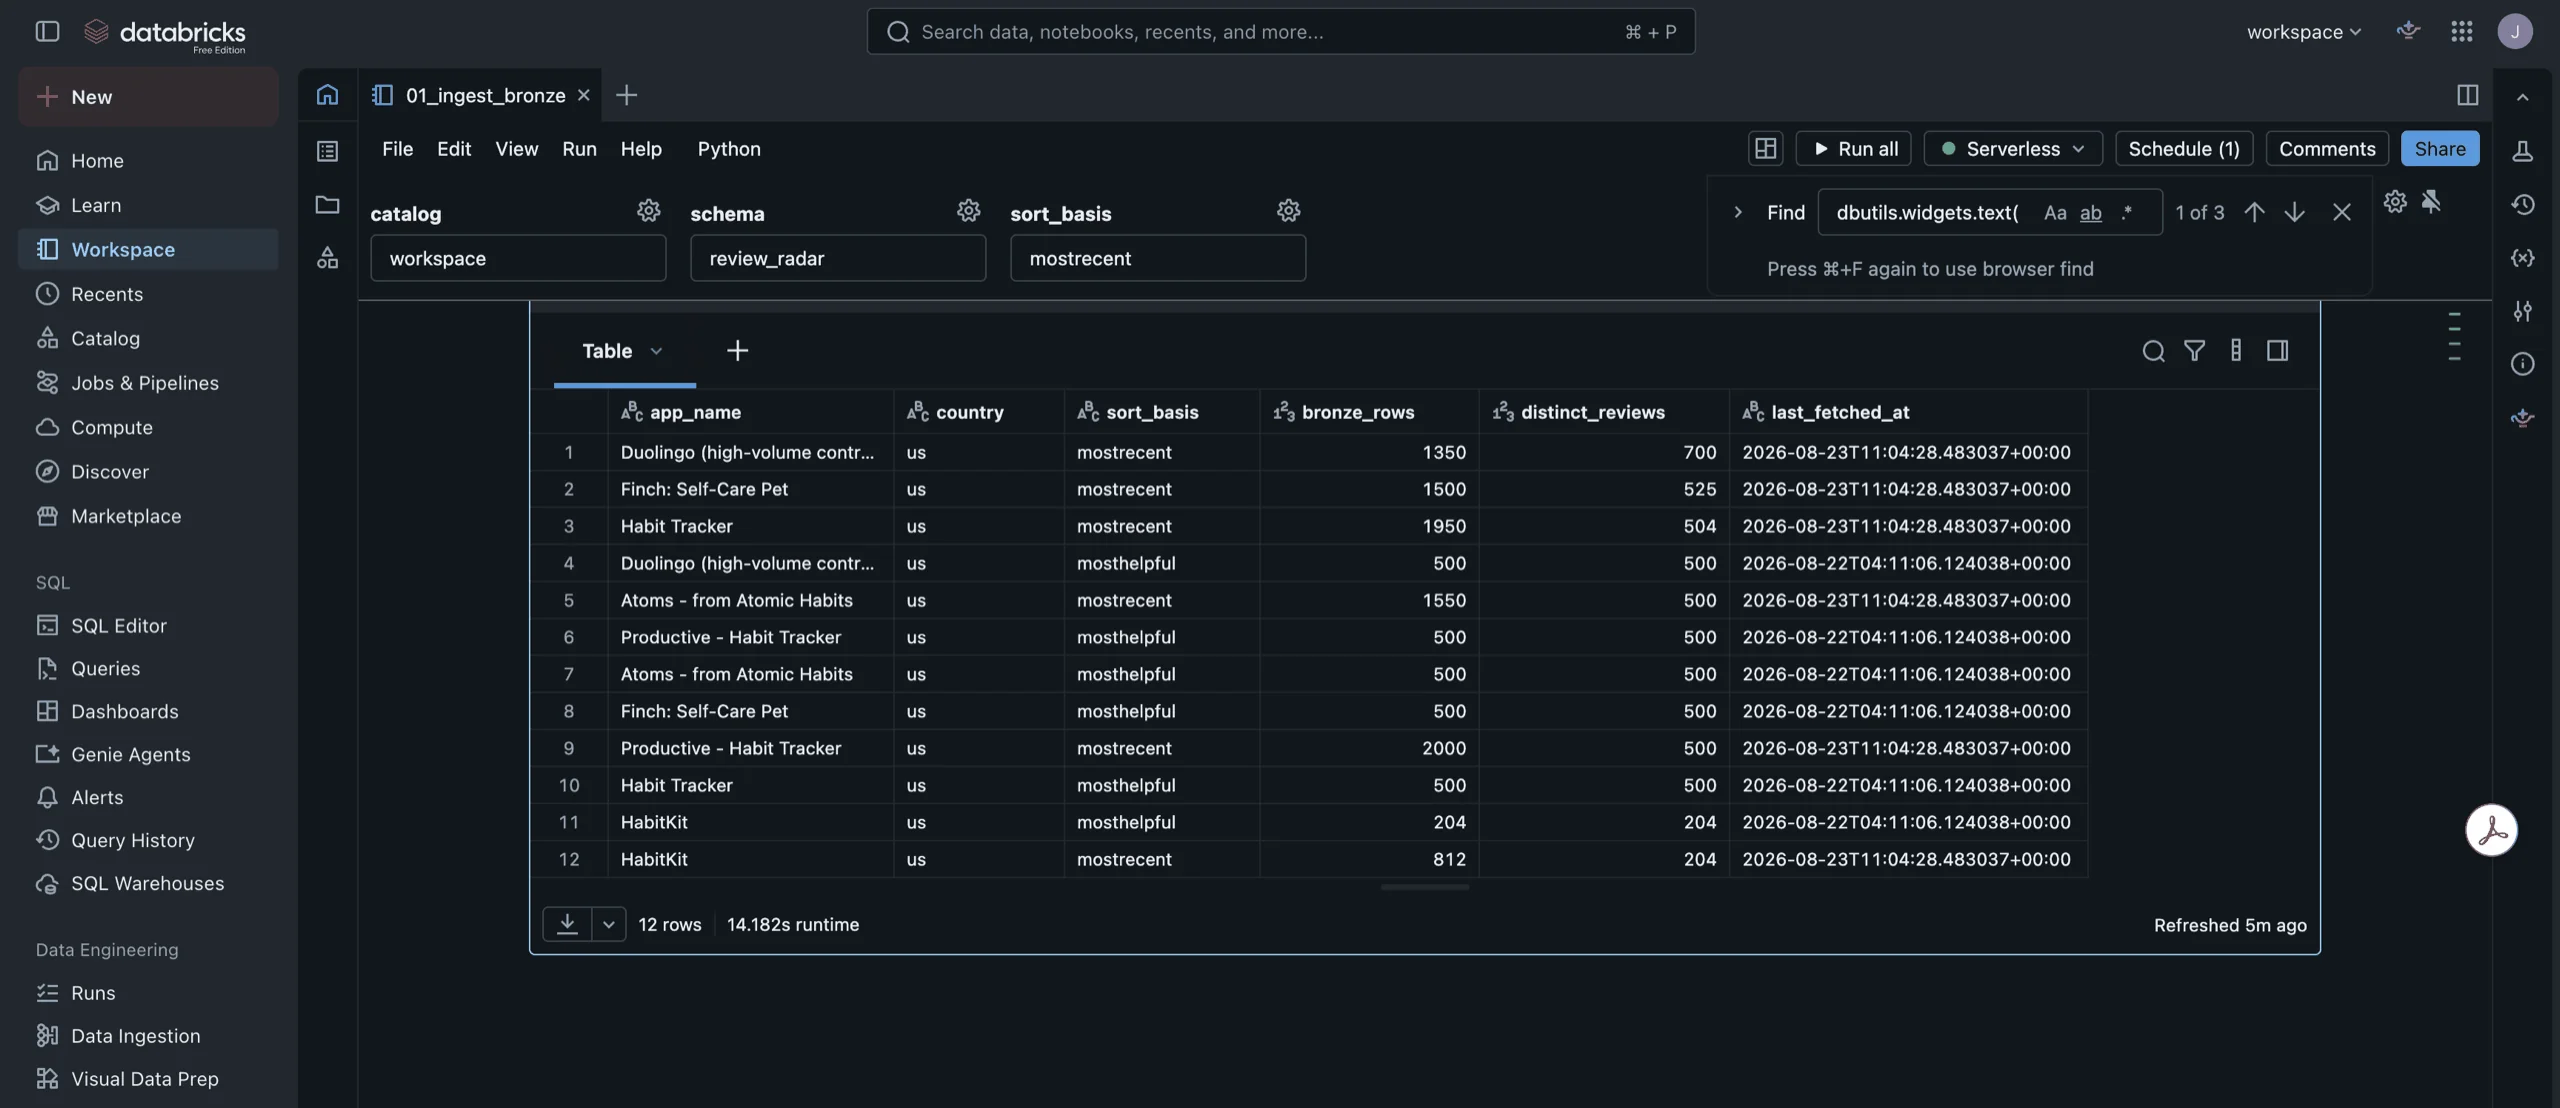
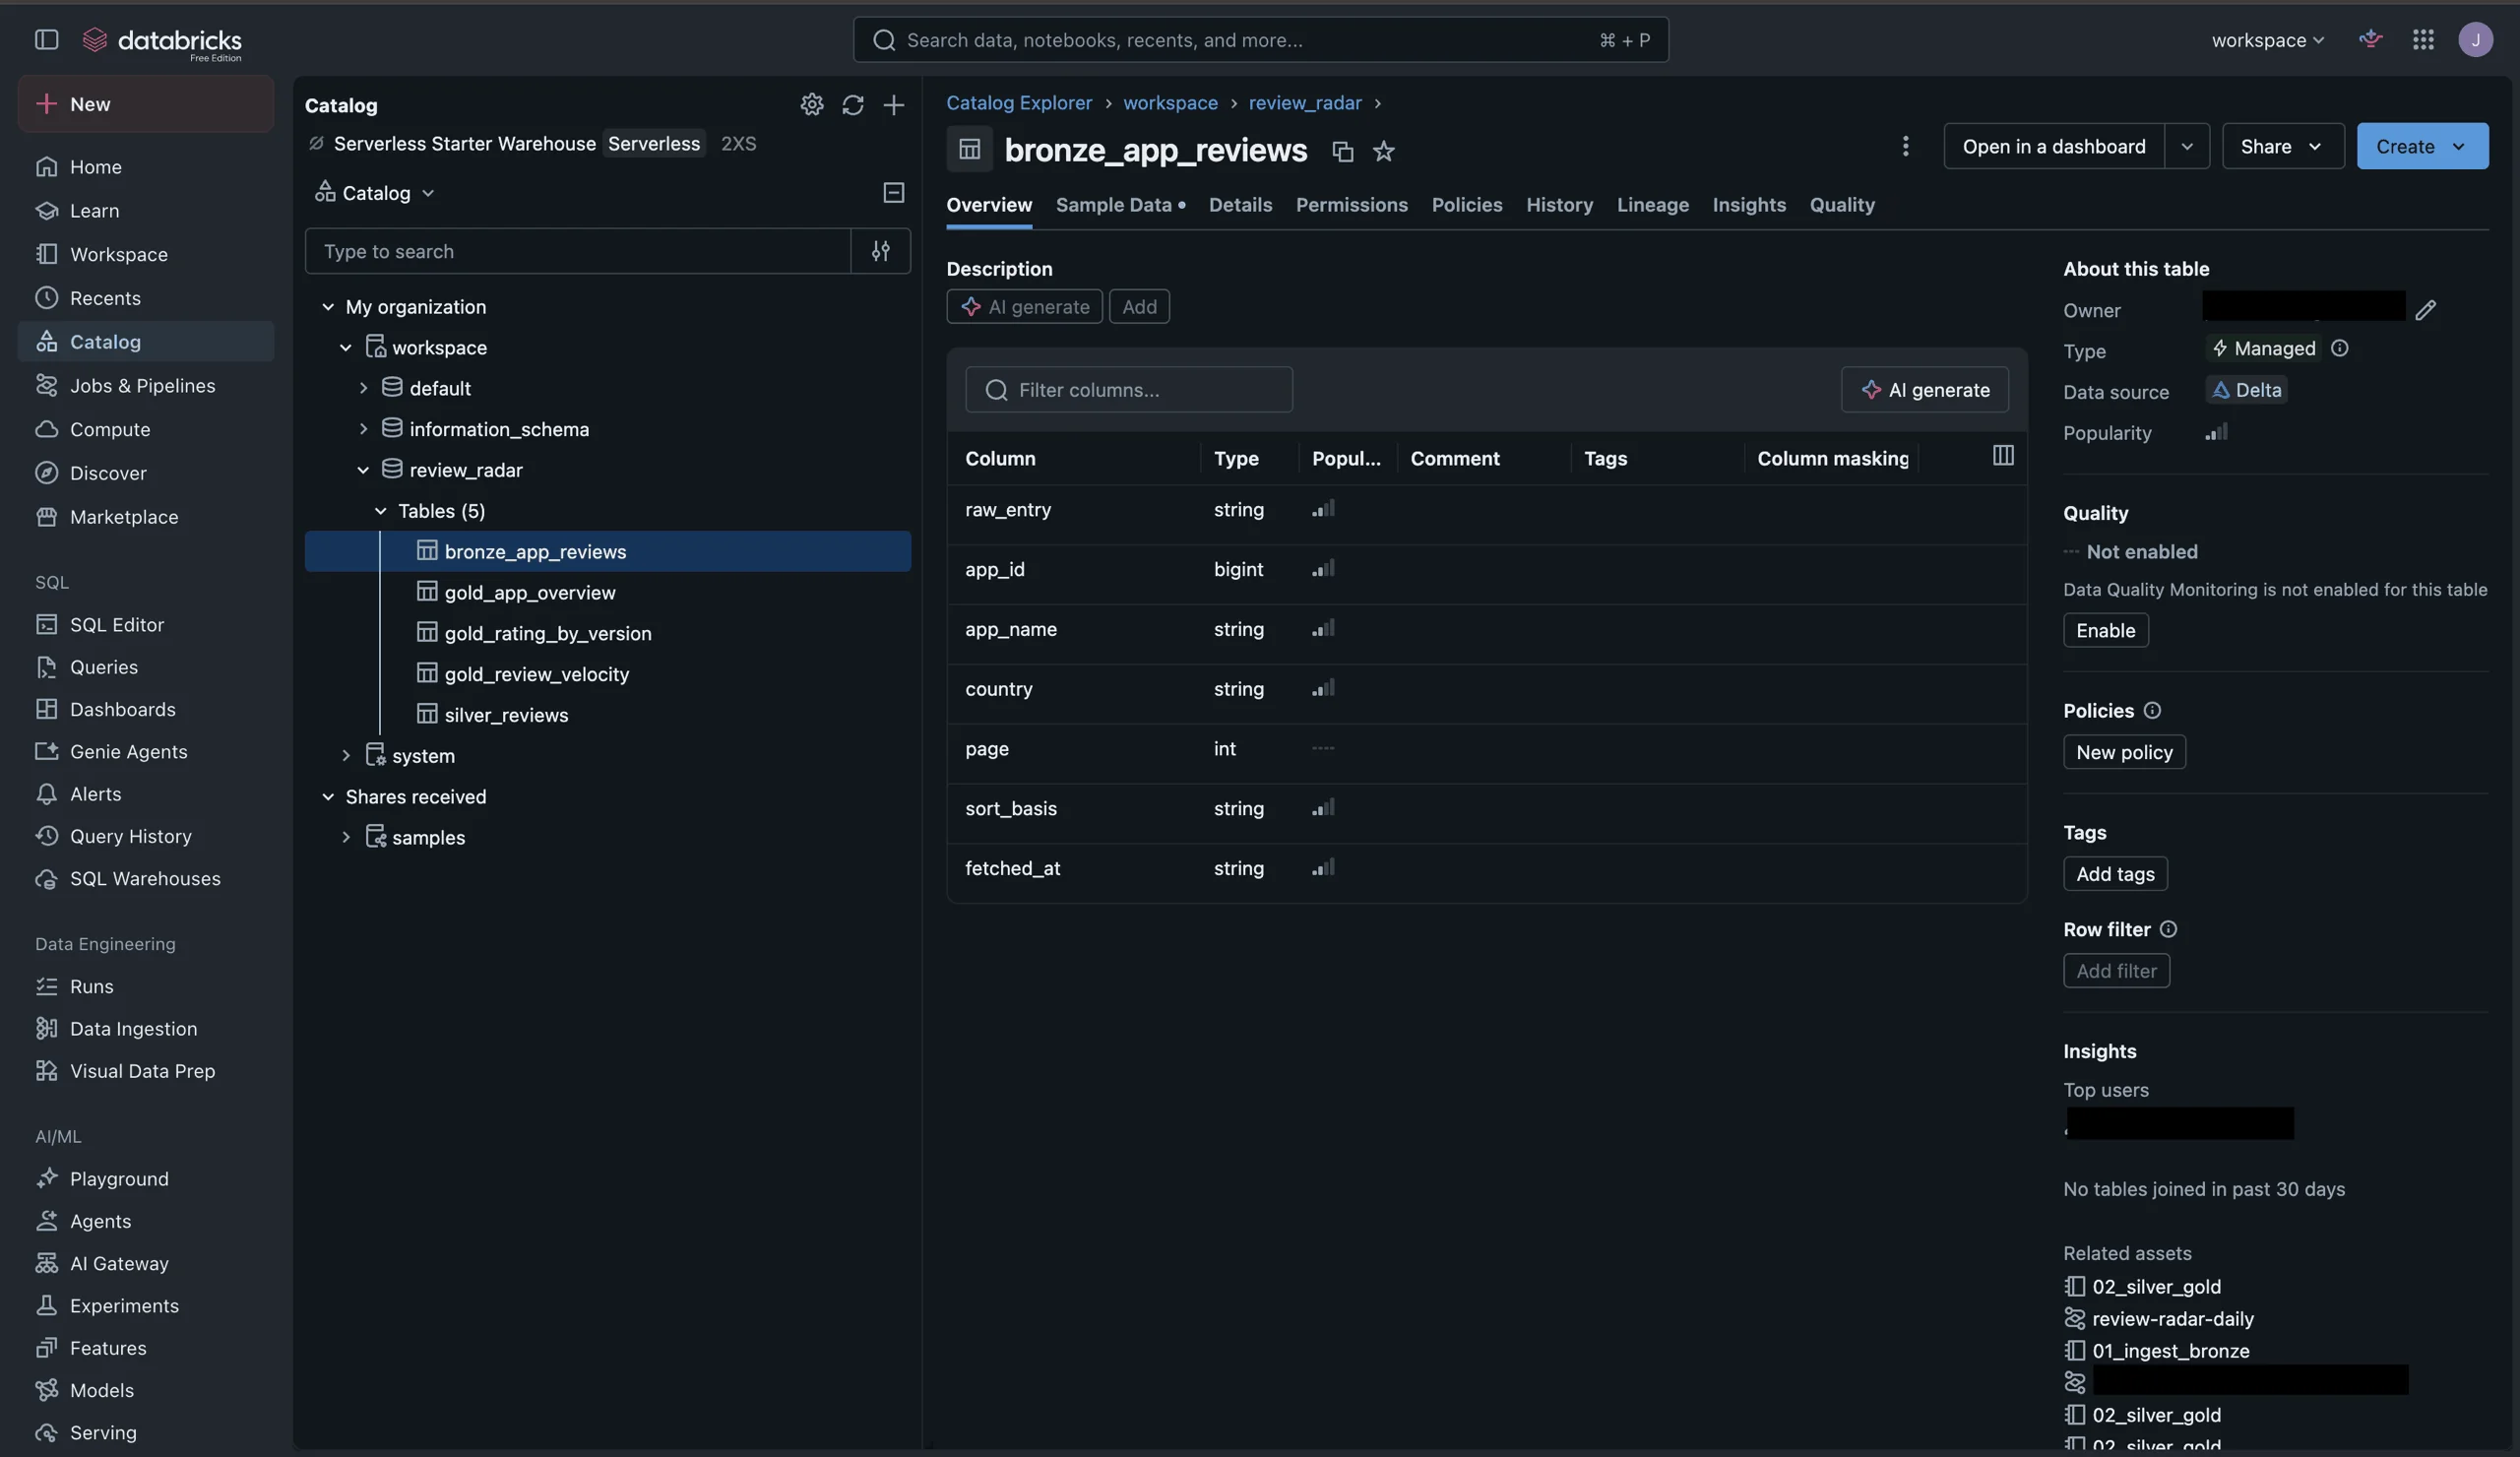
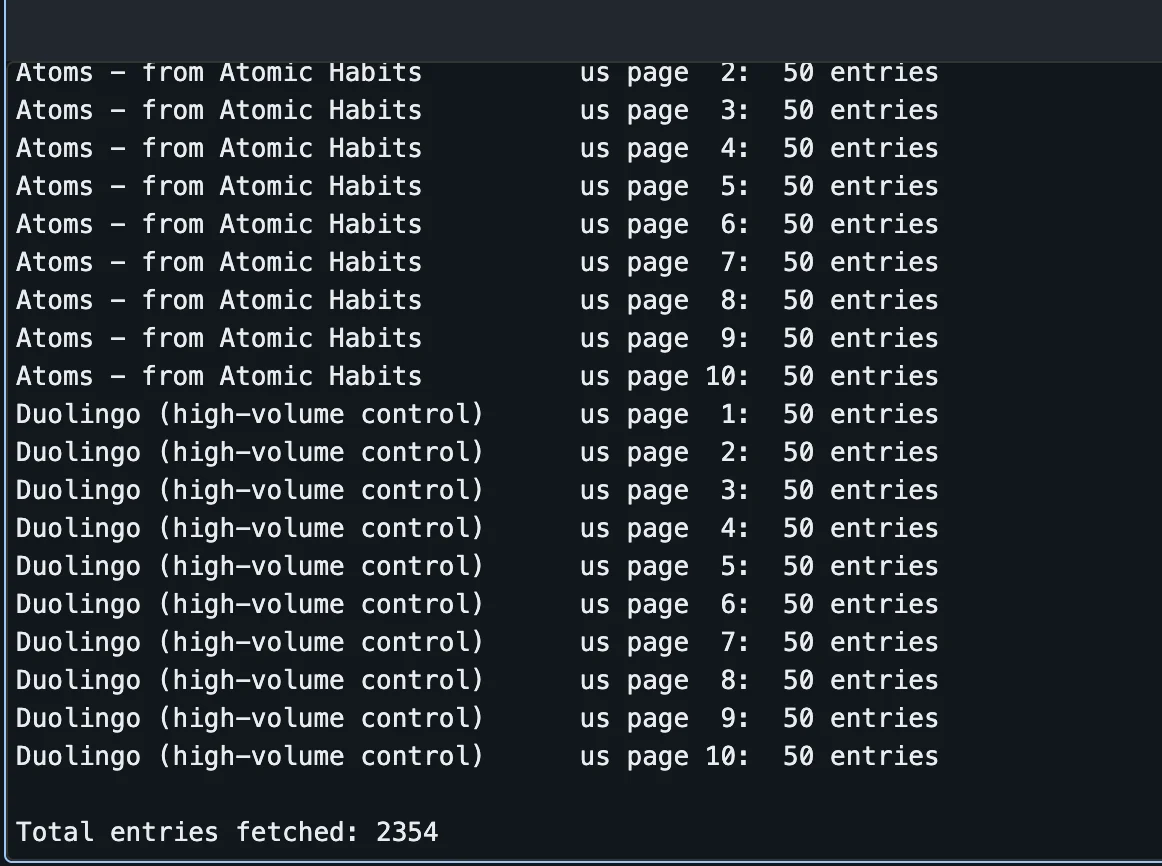
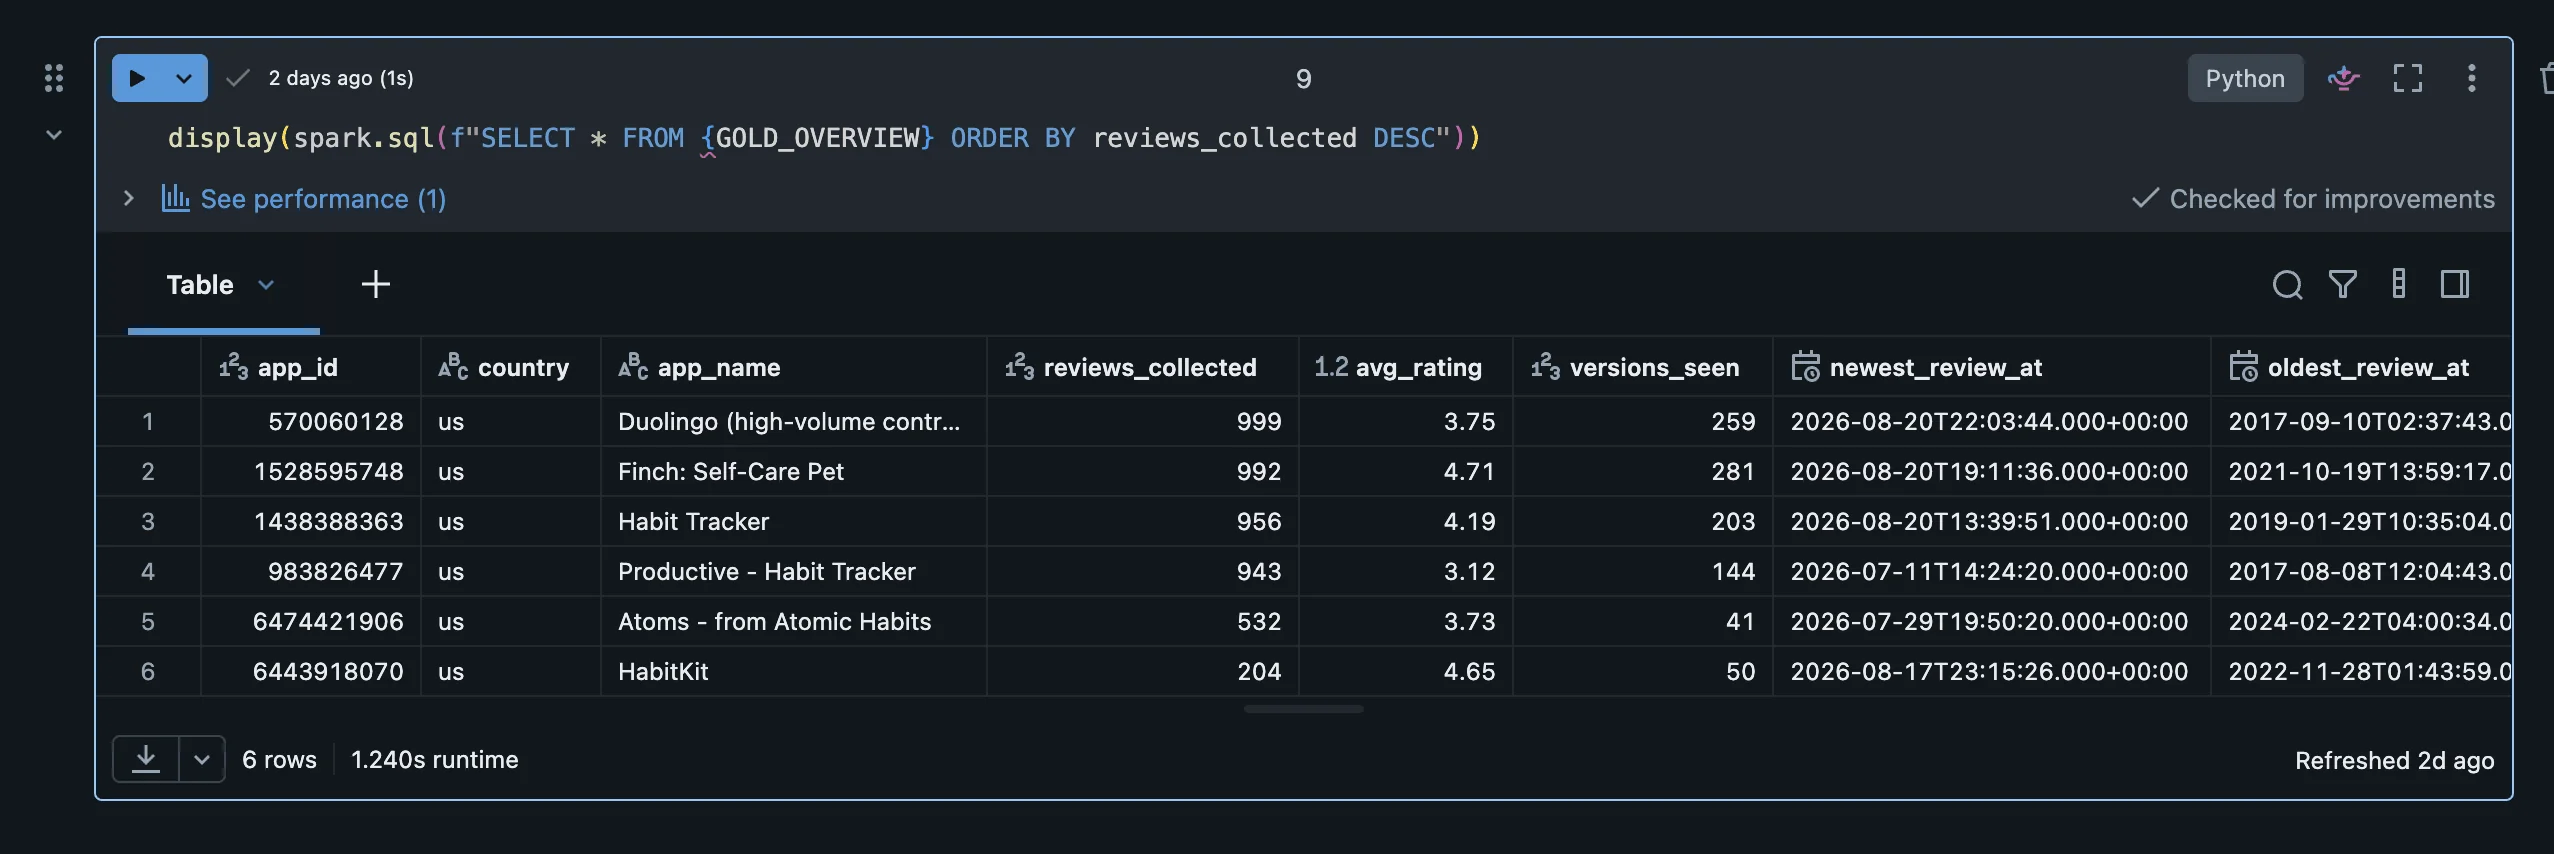
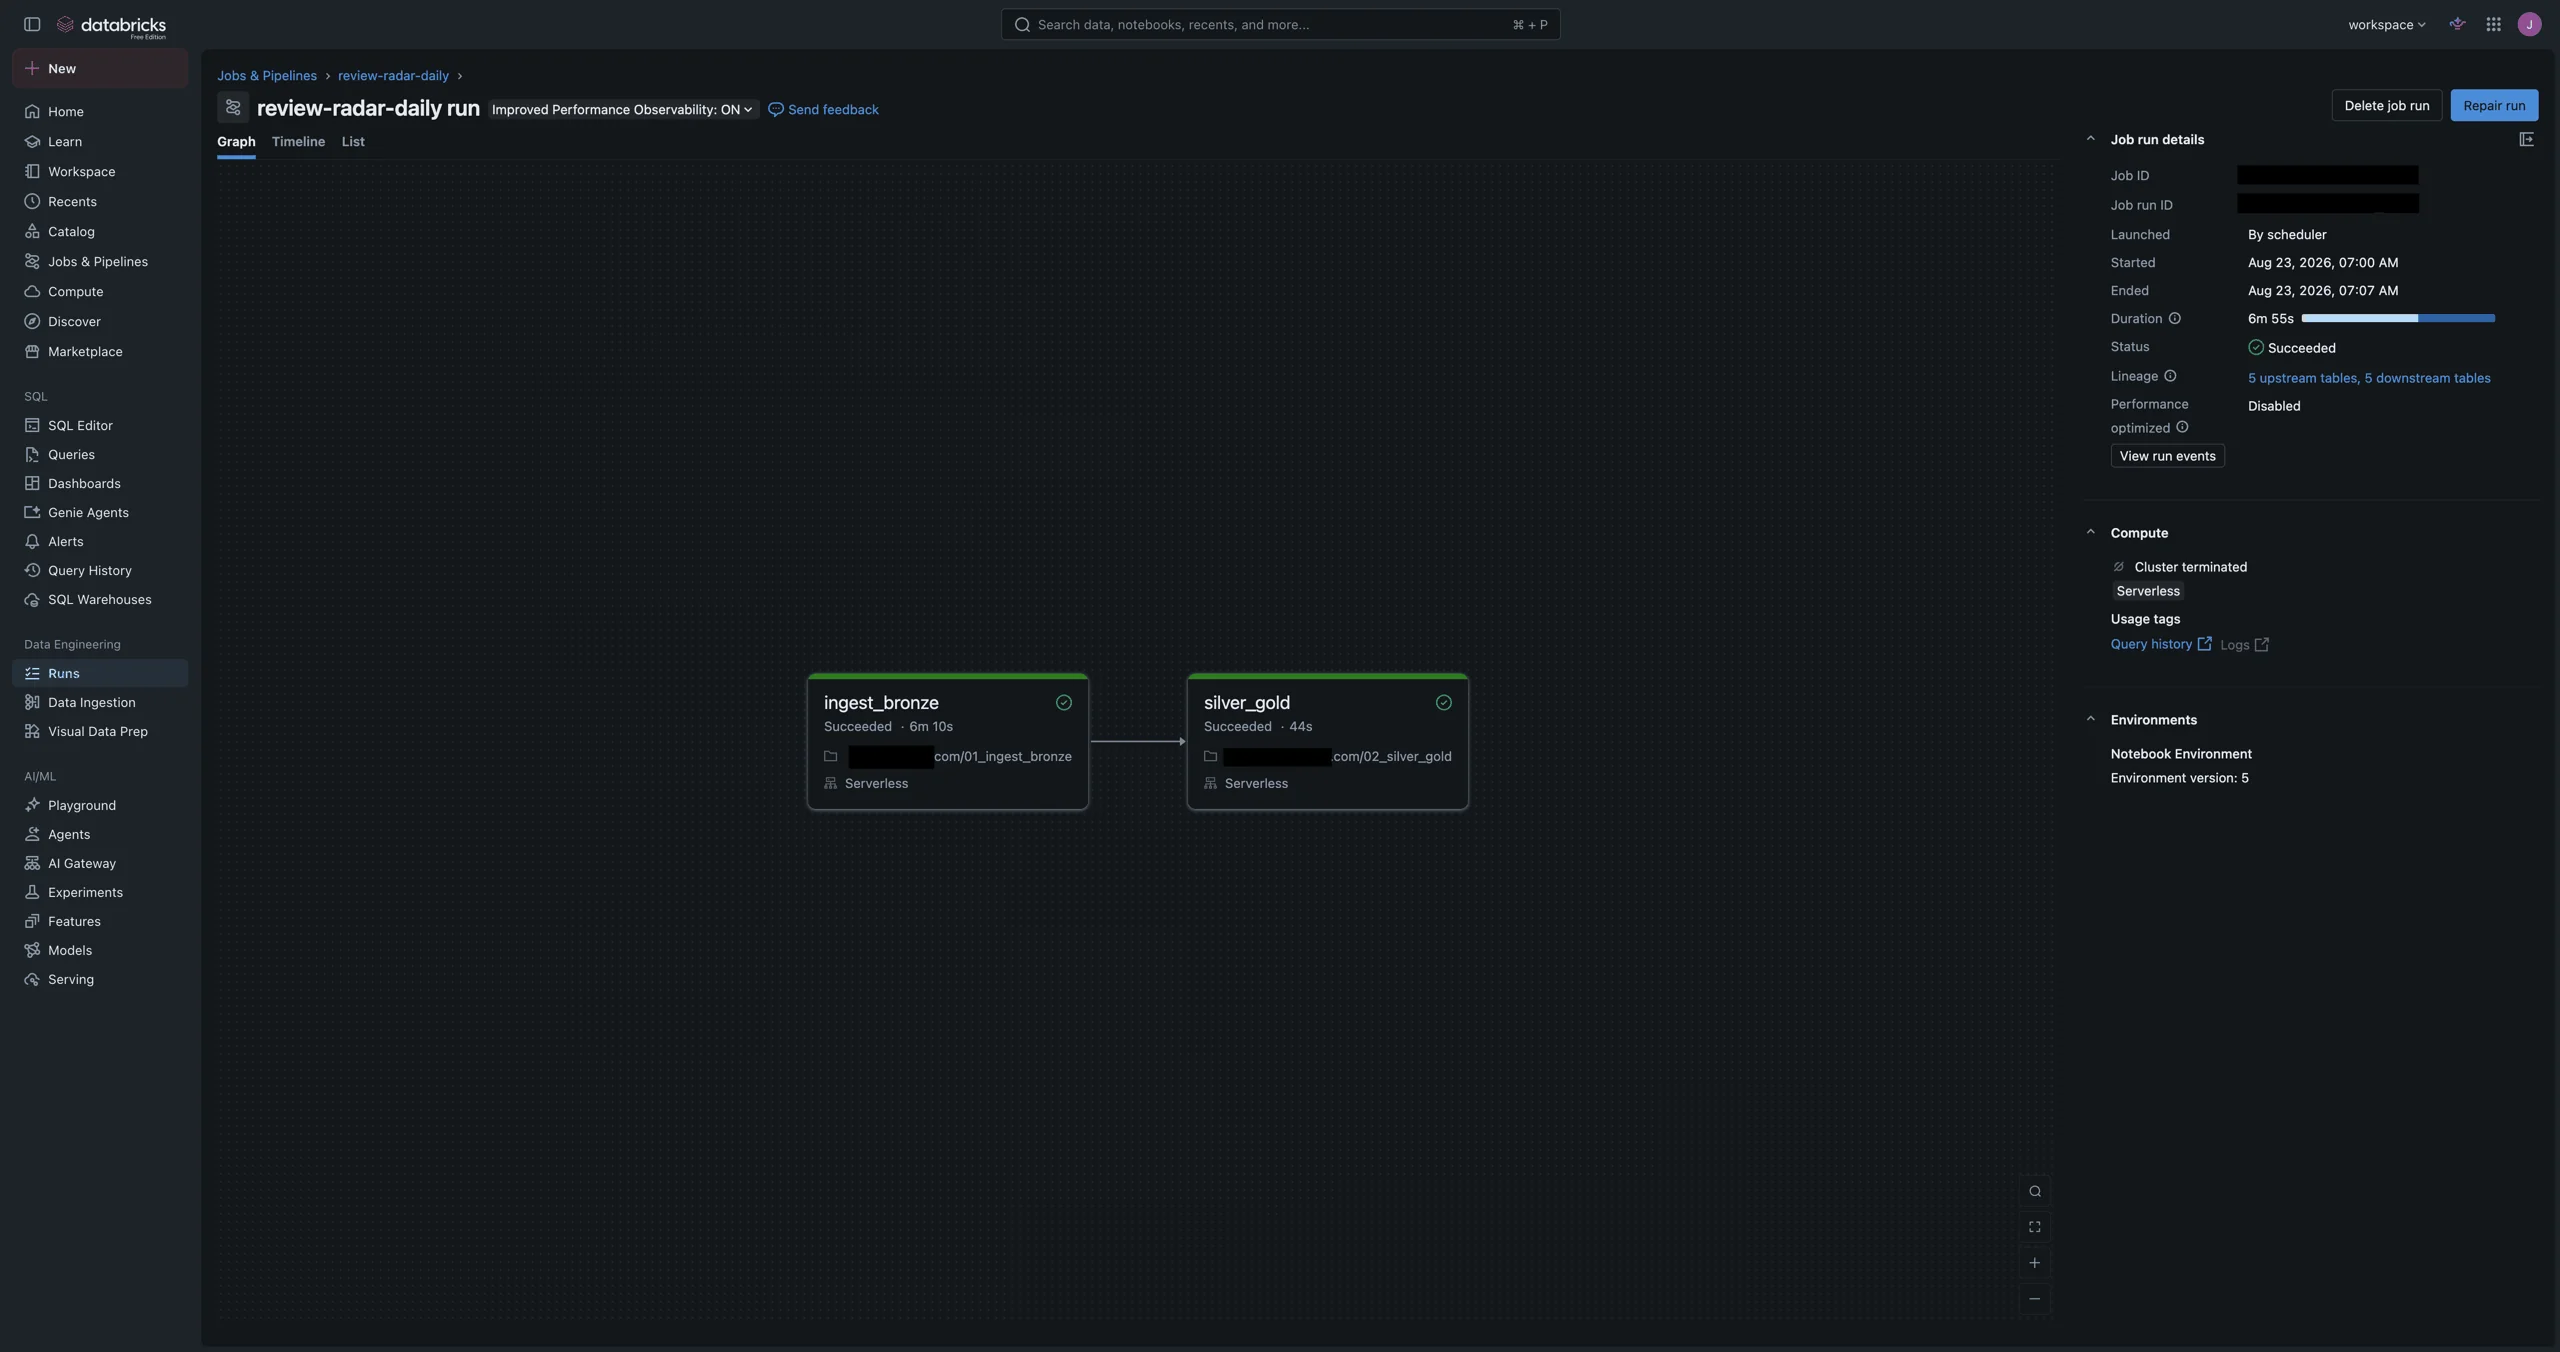
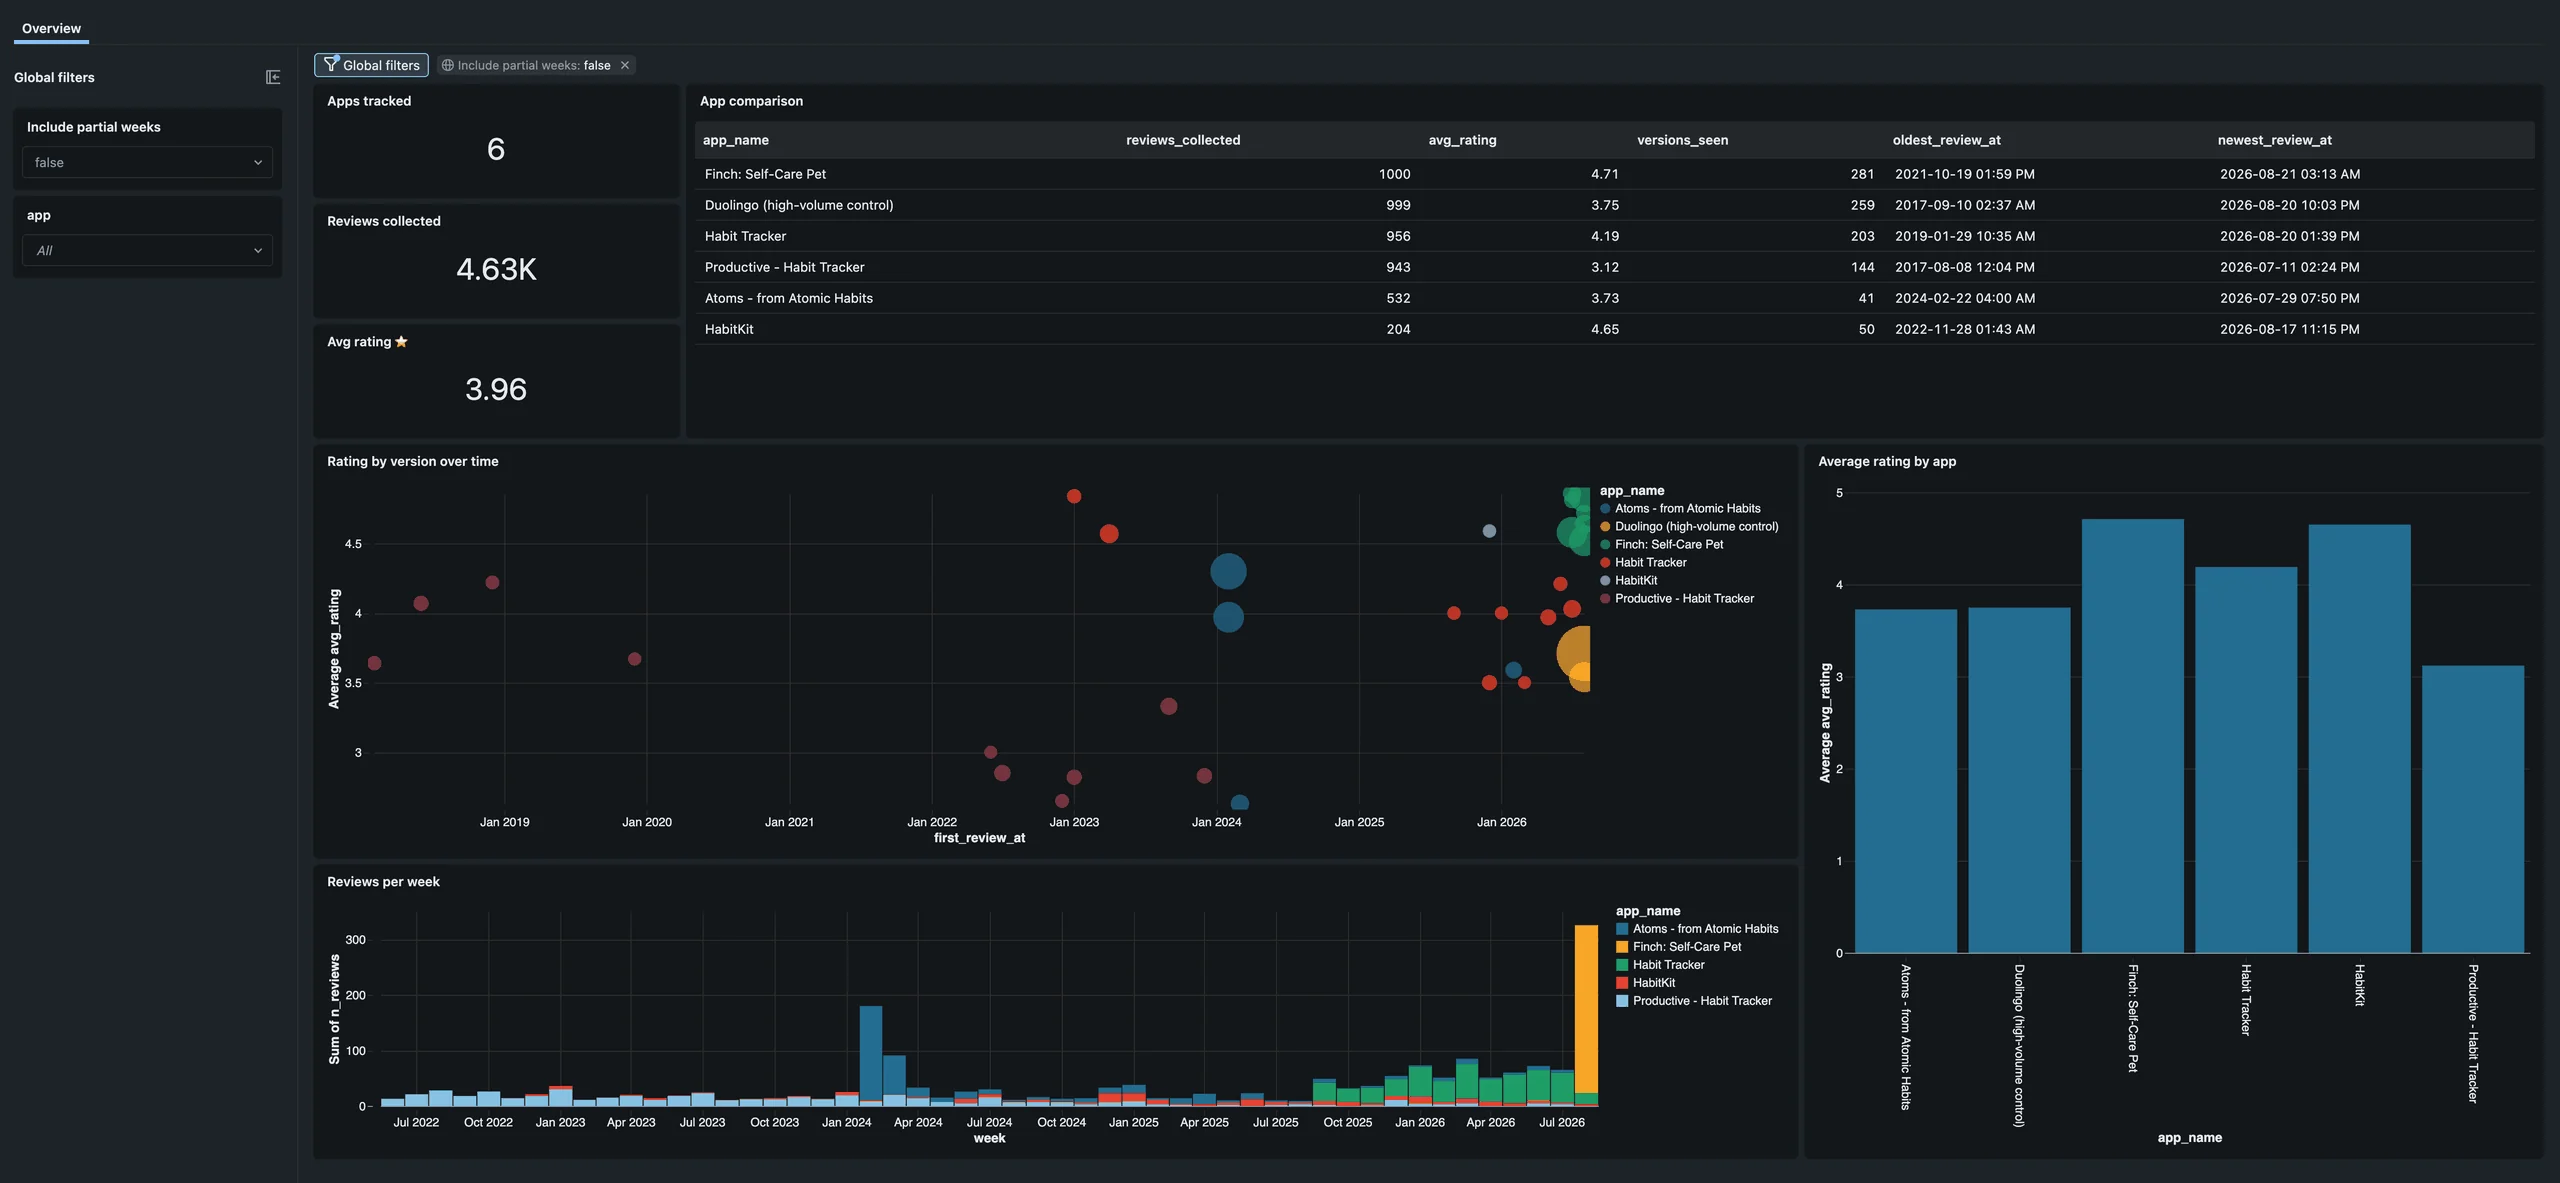
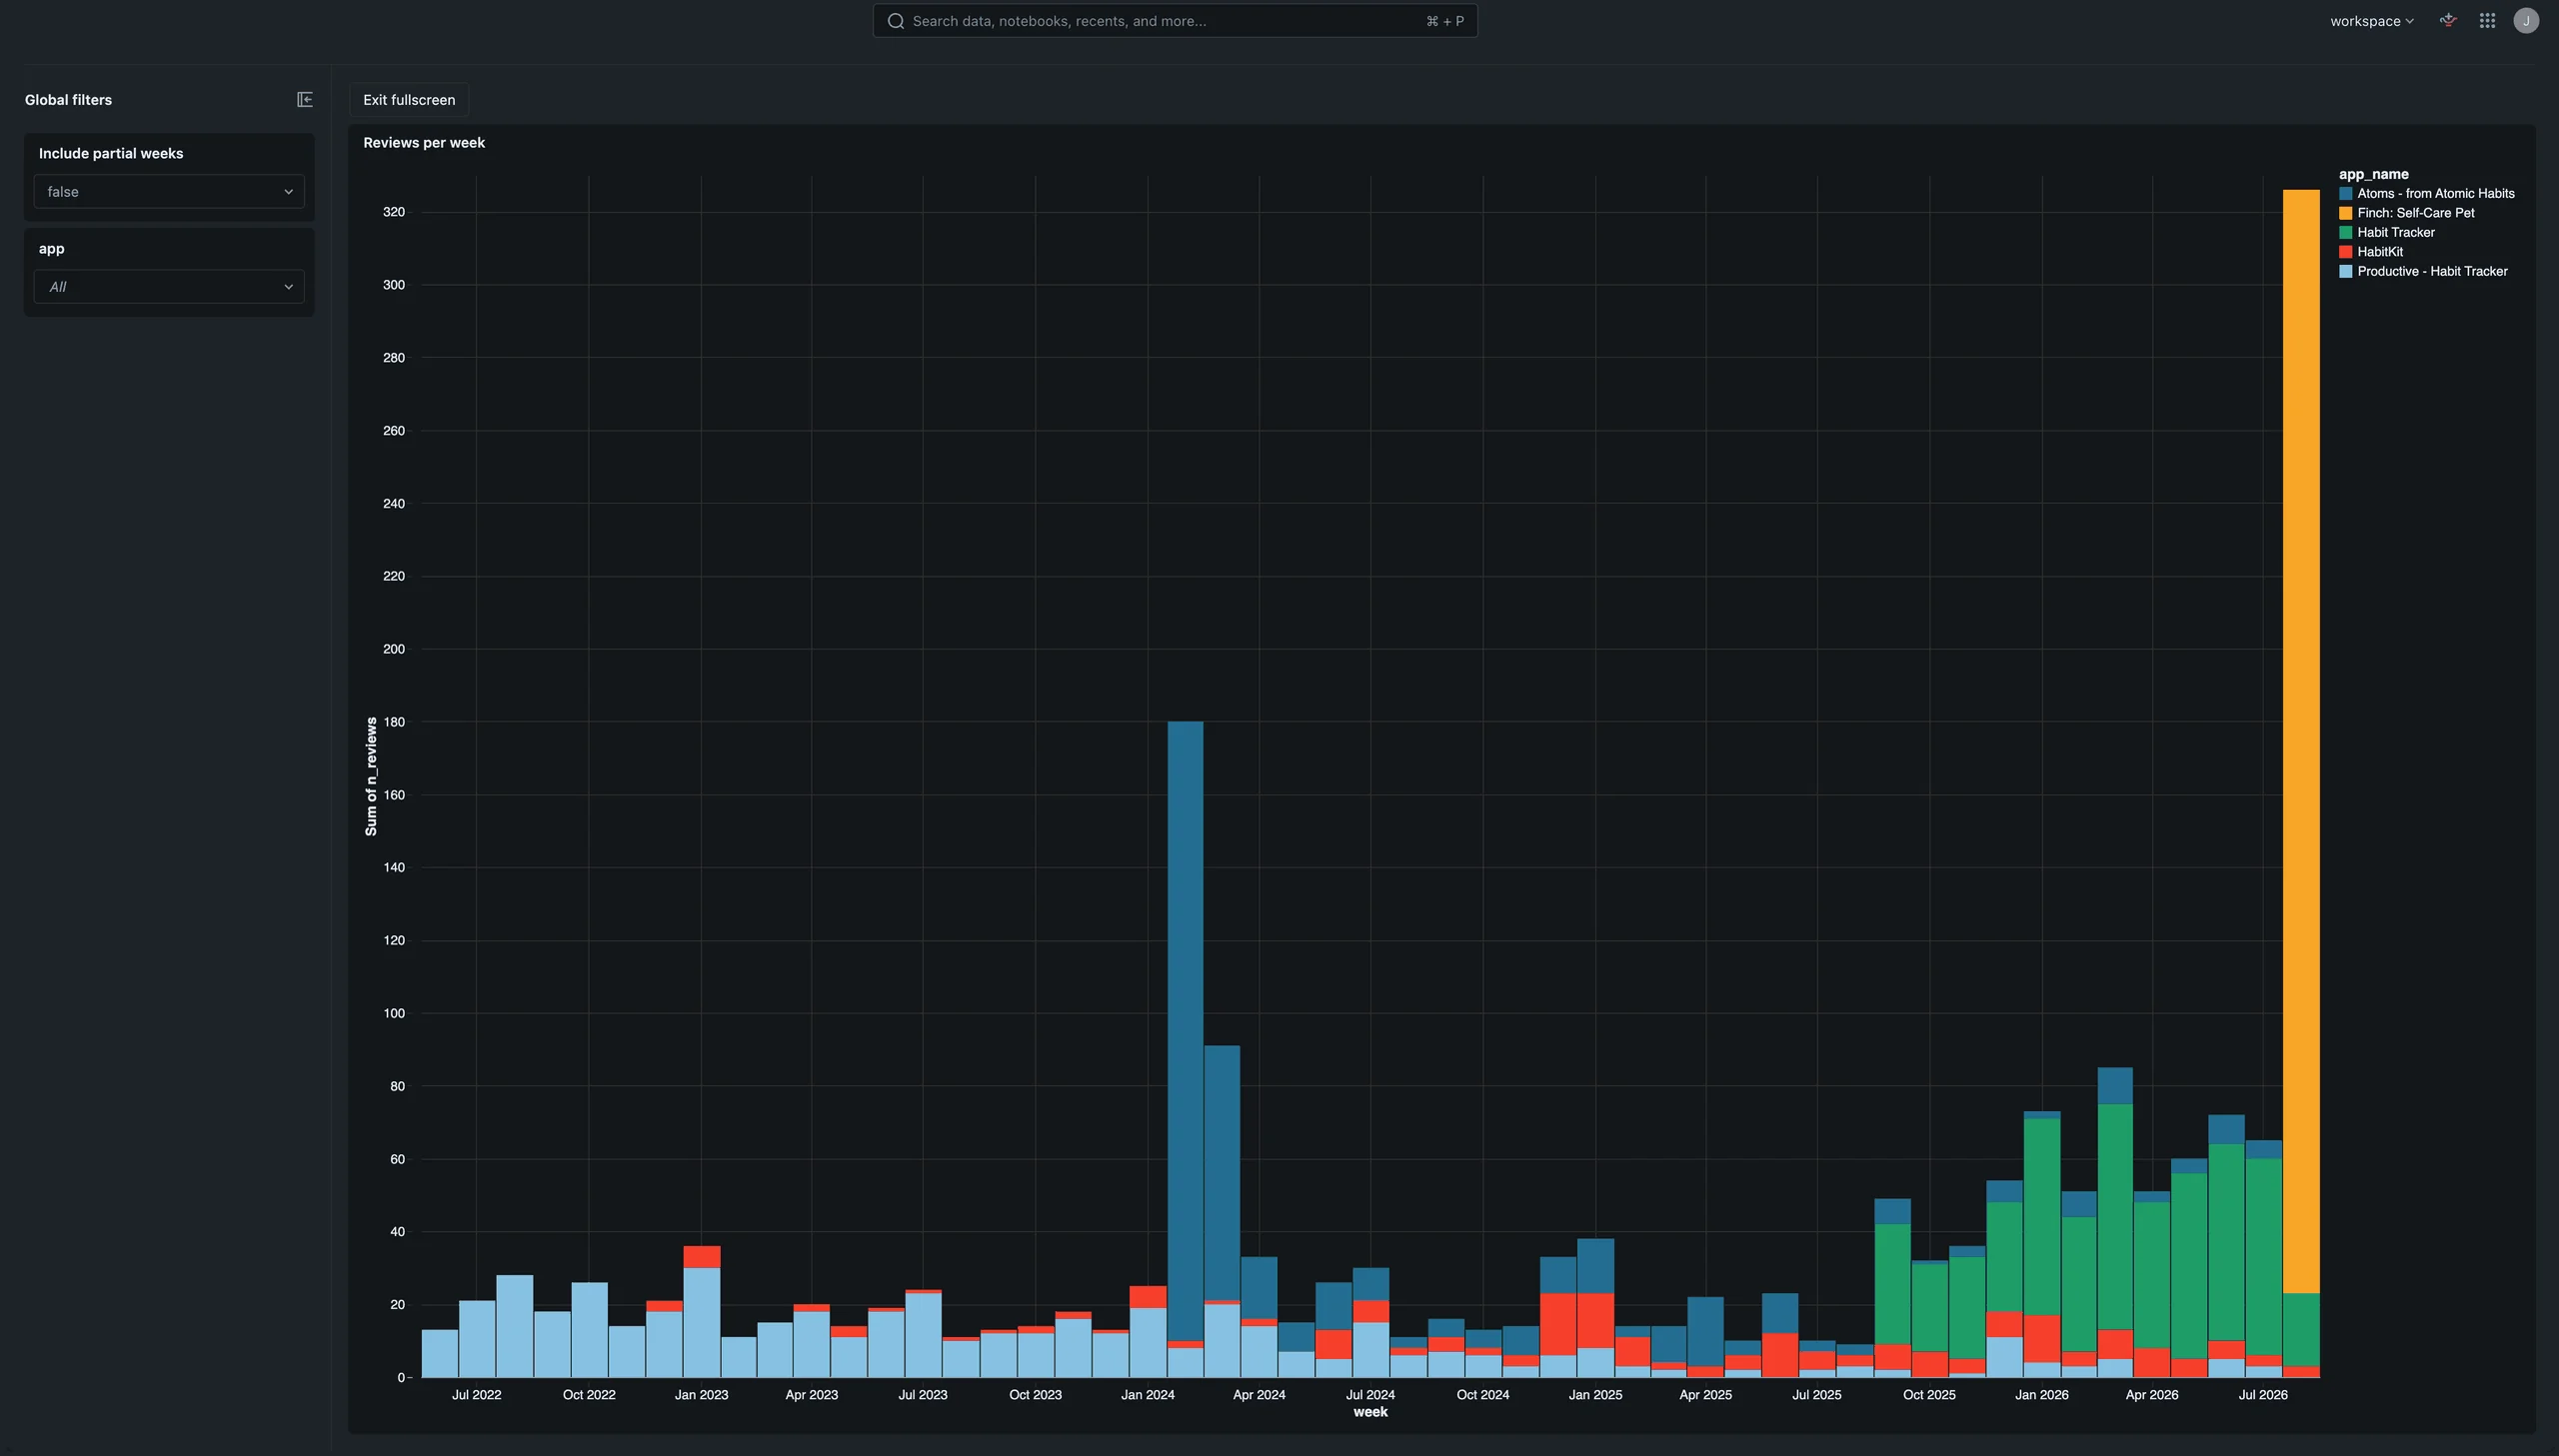
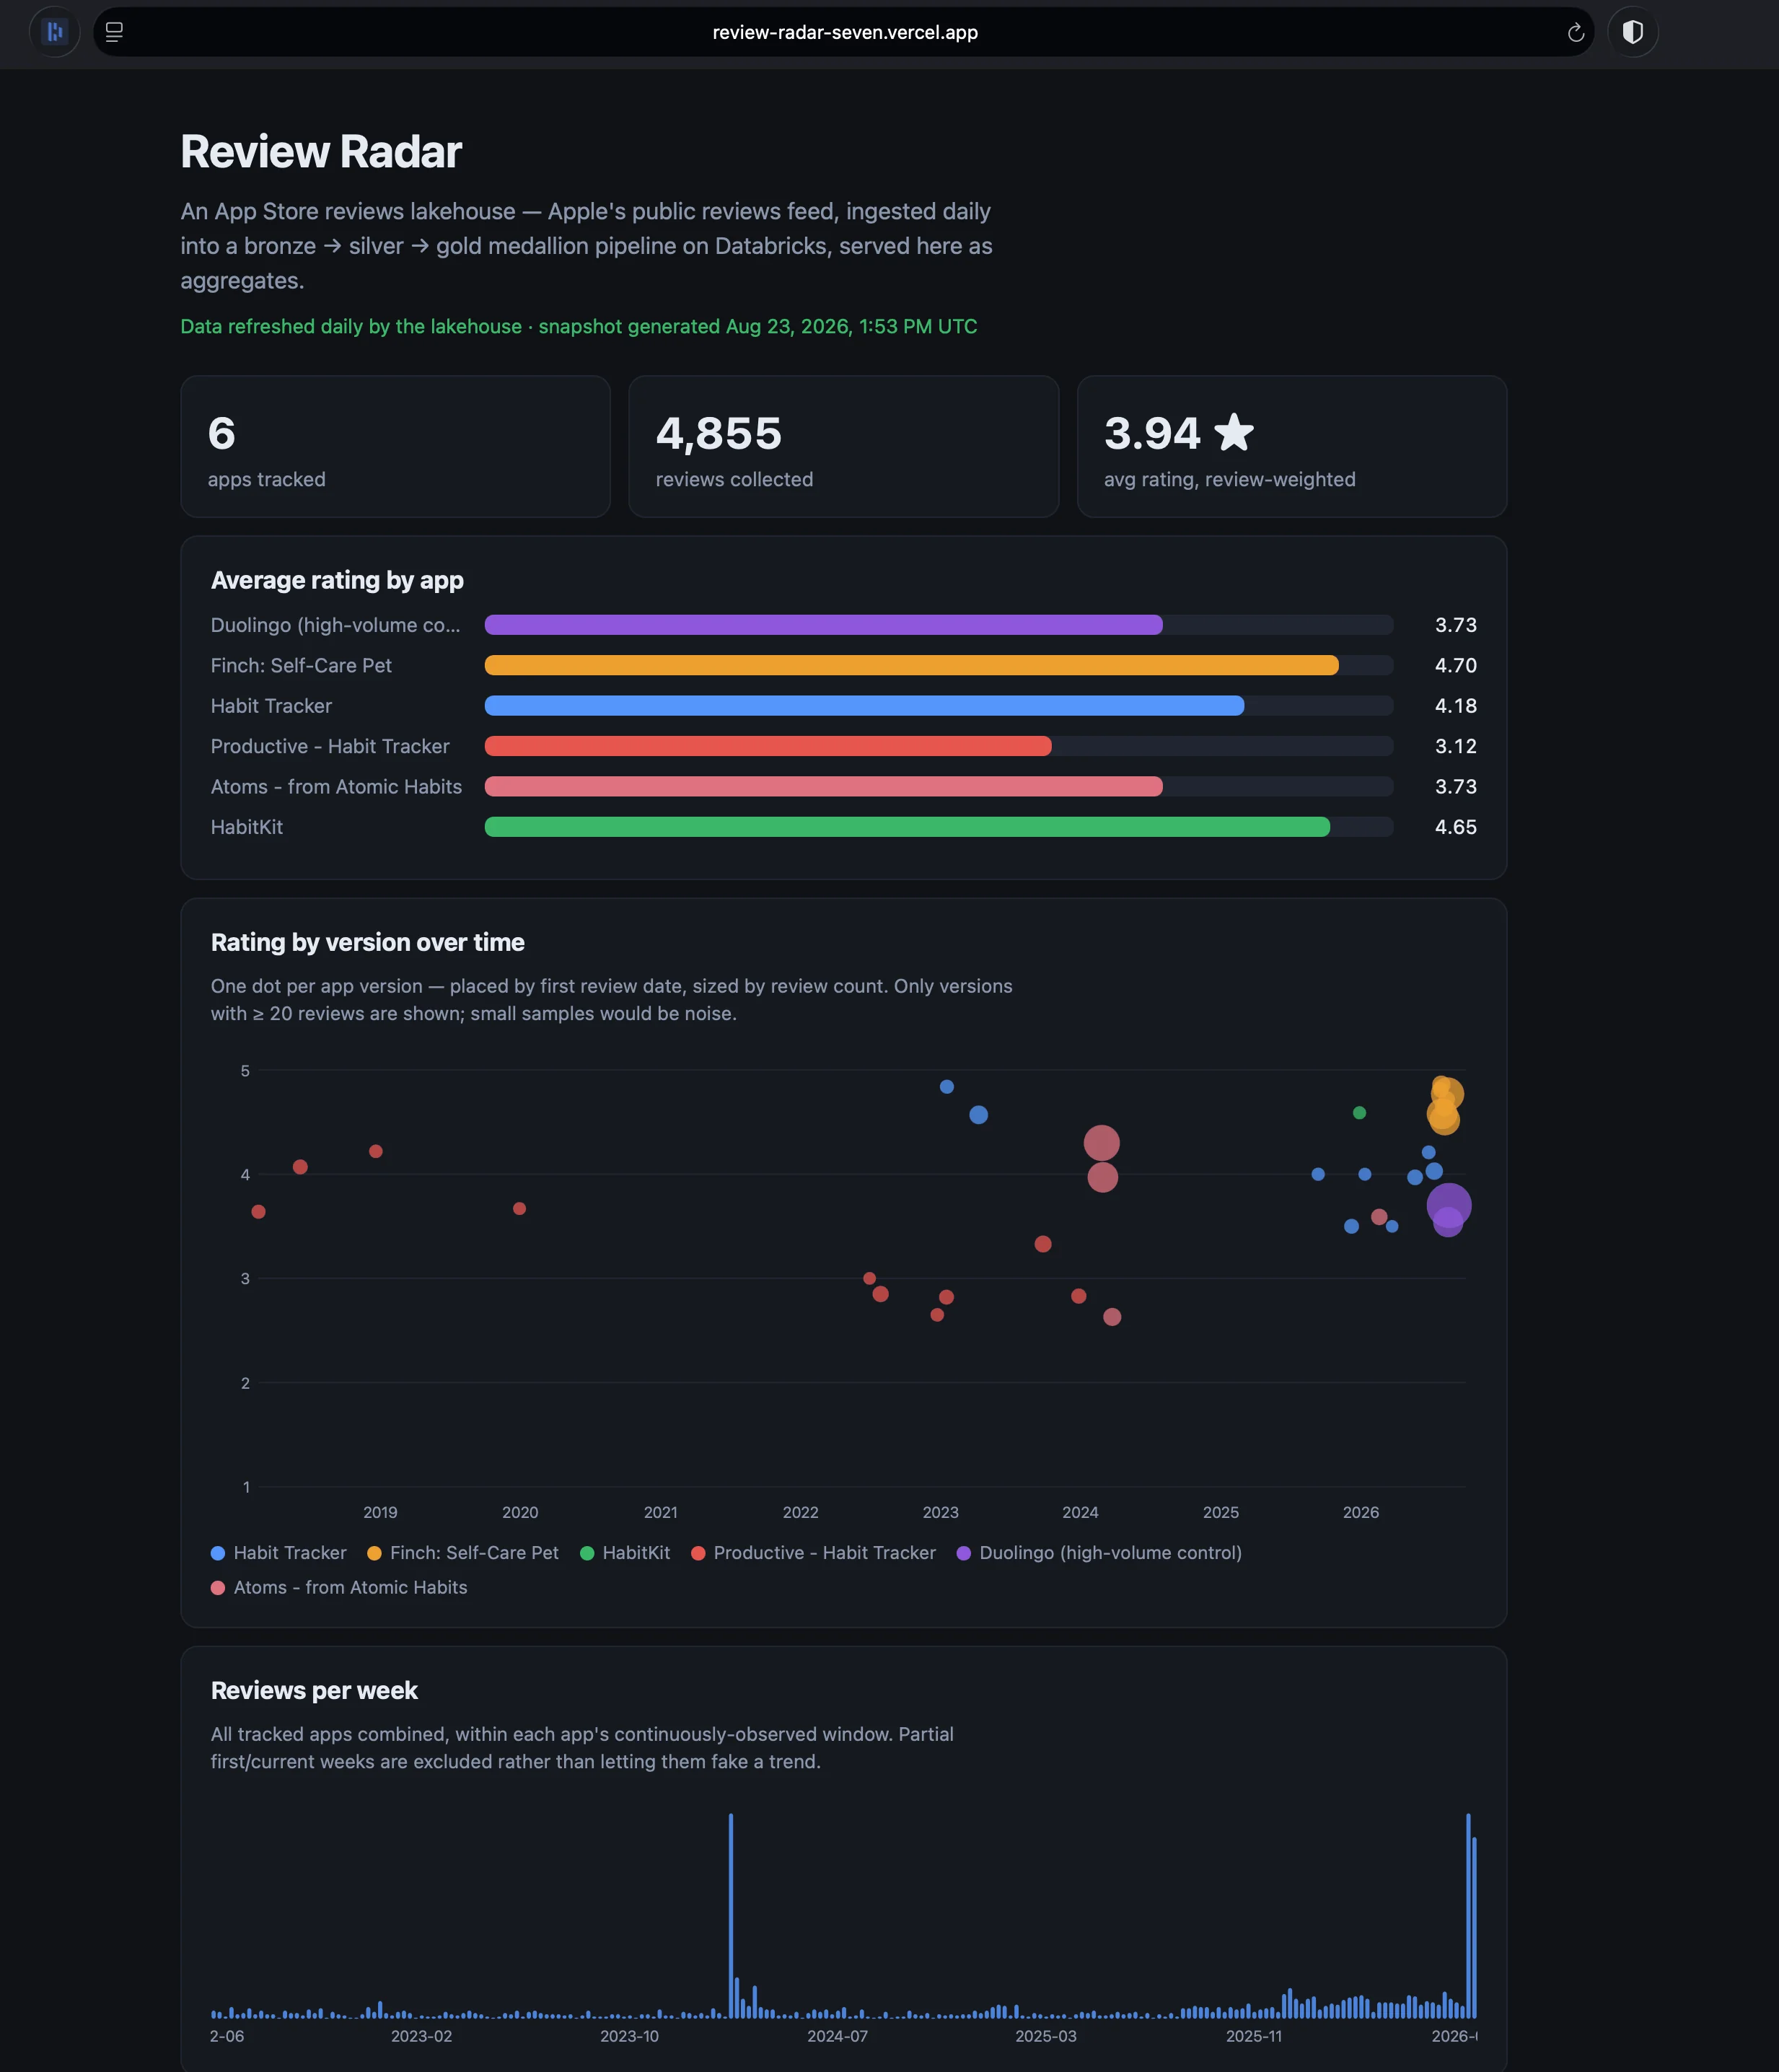
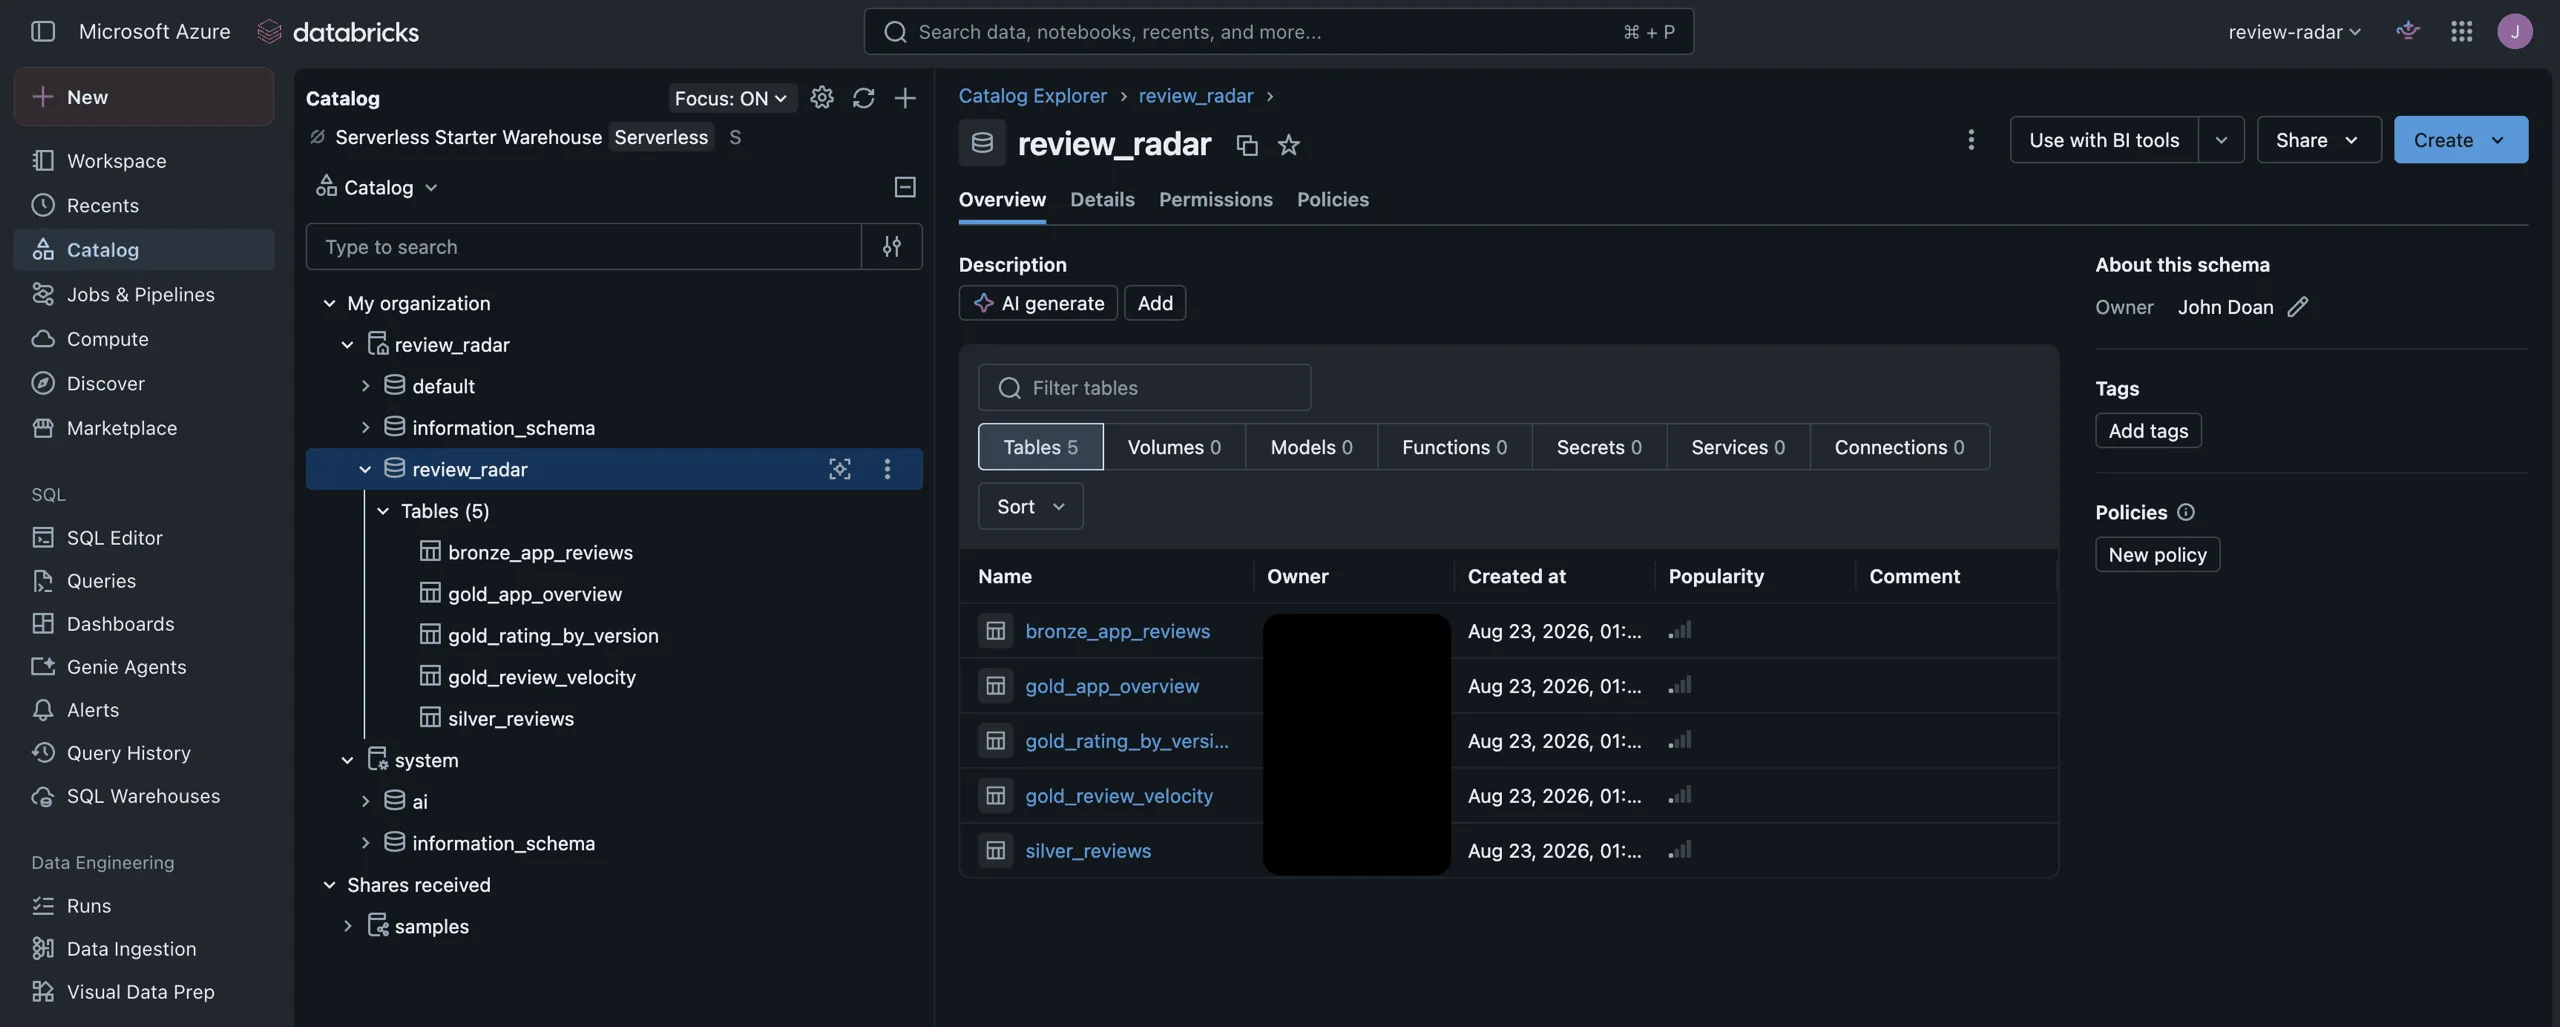
A daily pipeline that ingests Apple's public App Store reviews feed for my own app and five competitors into a bronze → silver → gold medallion lakehouse on Delta Lake, then publishes the gold layer as a public dashboard. Runs on Databricks Free Edition at $0.
- Stage 1: Bronze ingest — raw JSON appended as fetched, plus a one-time
mosthelpfulbackfill for version history (the feed caps at ~500 recent reviews). - Stage 2: Silver
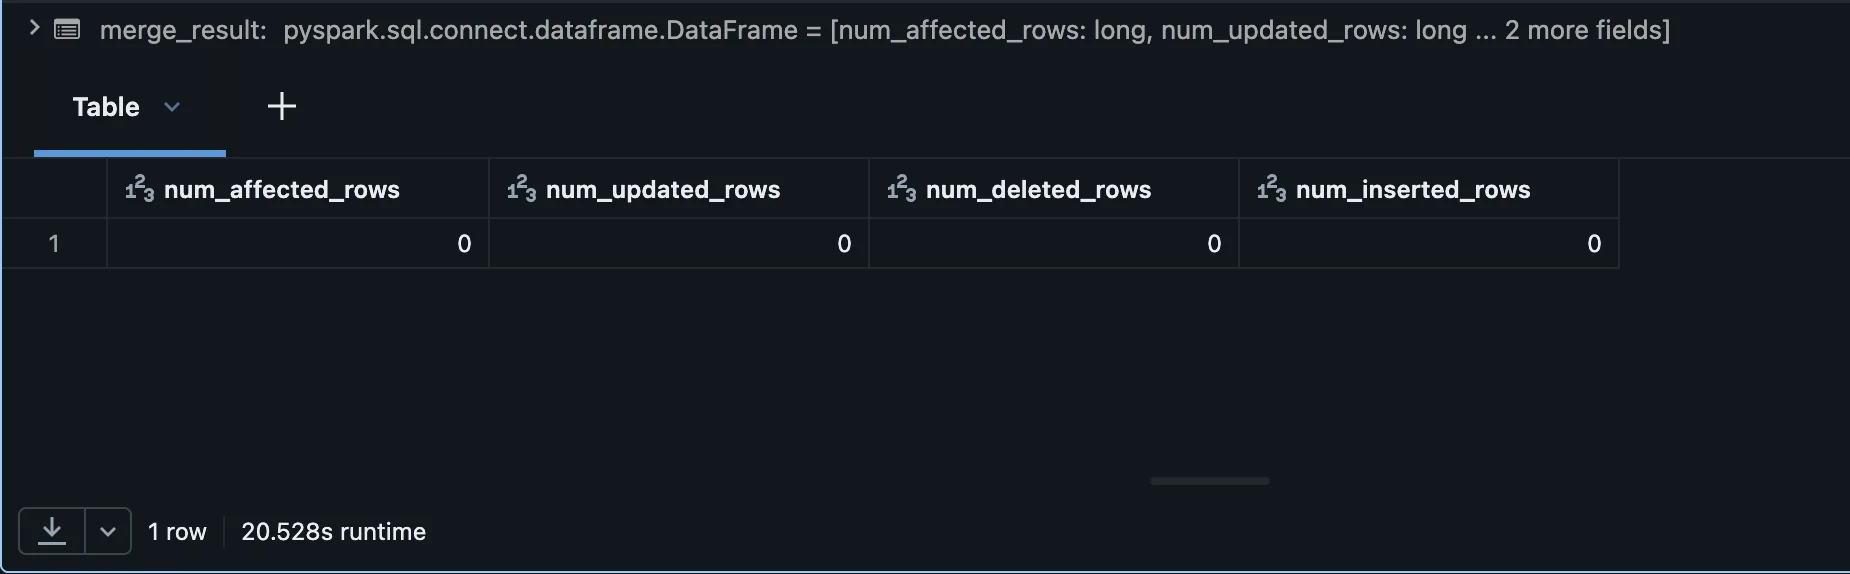
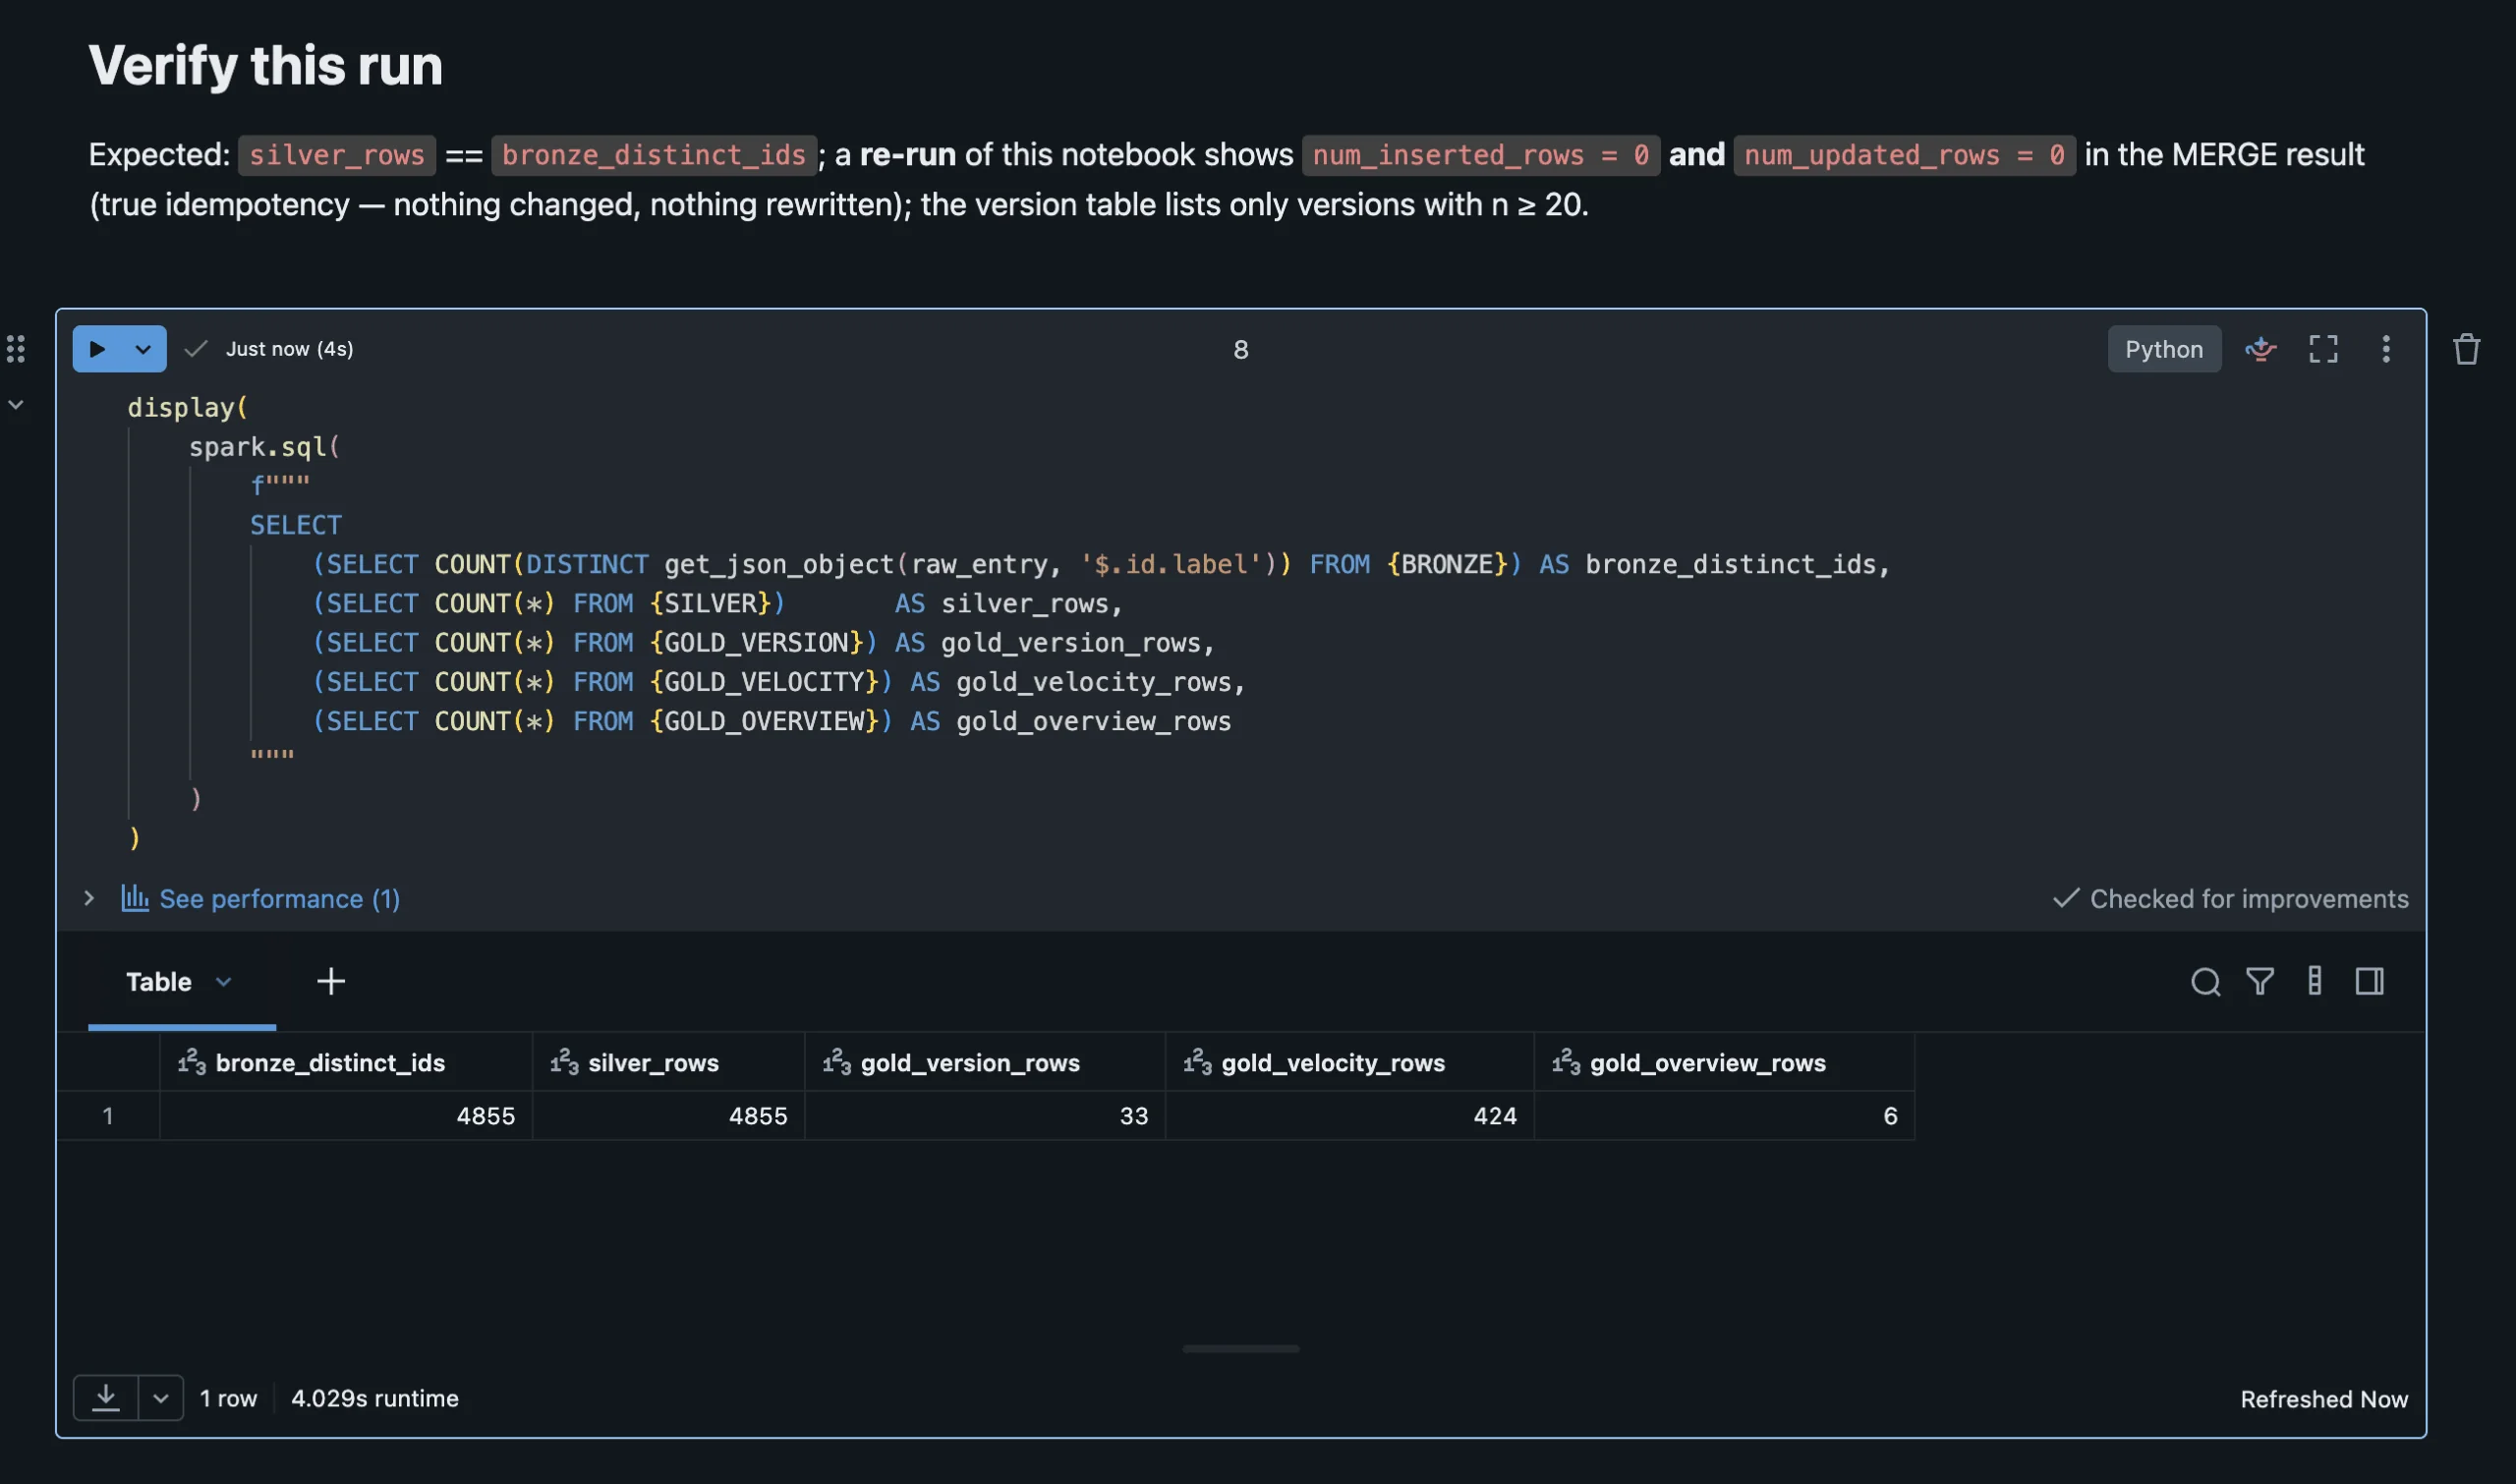
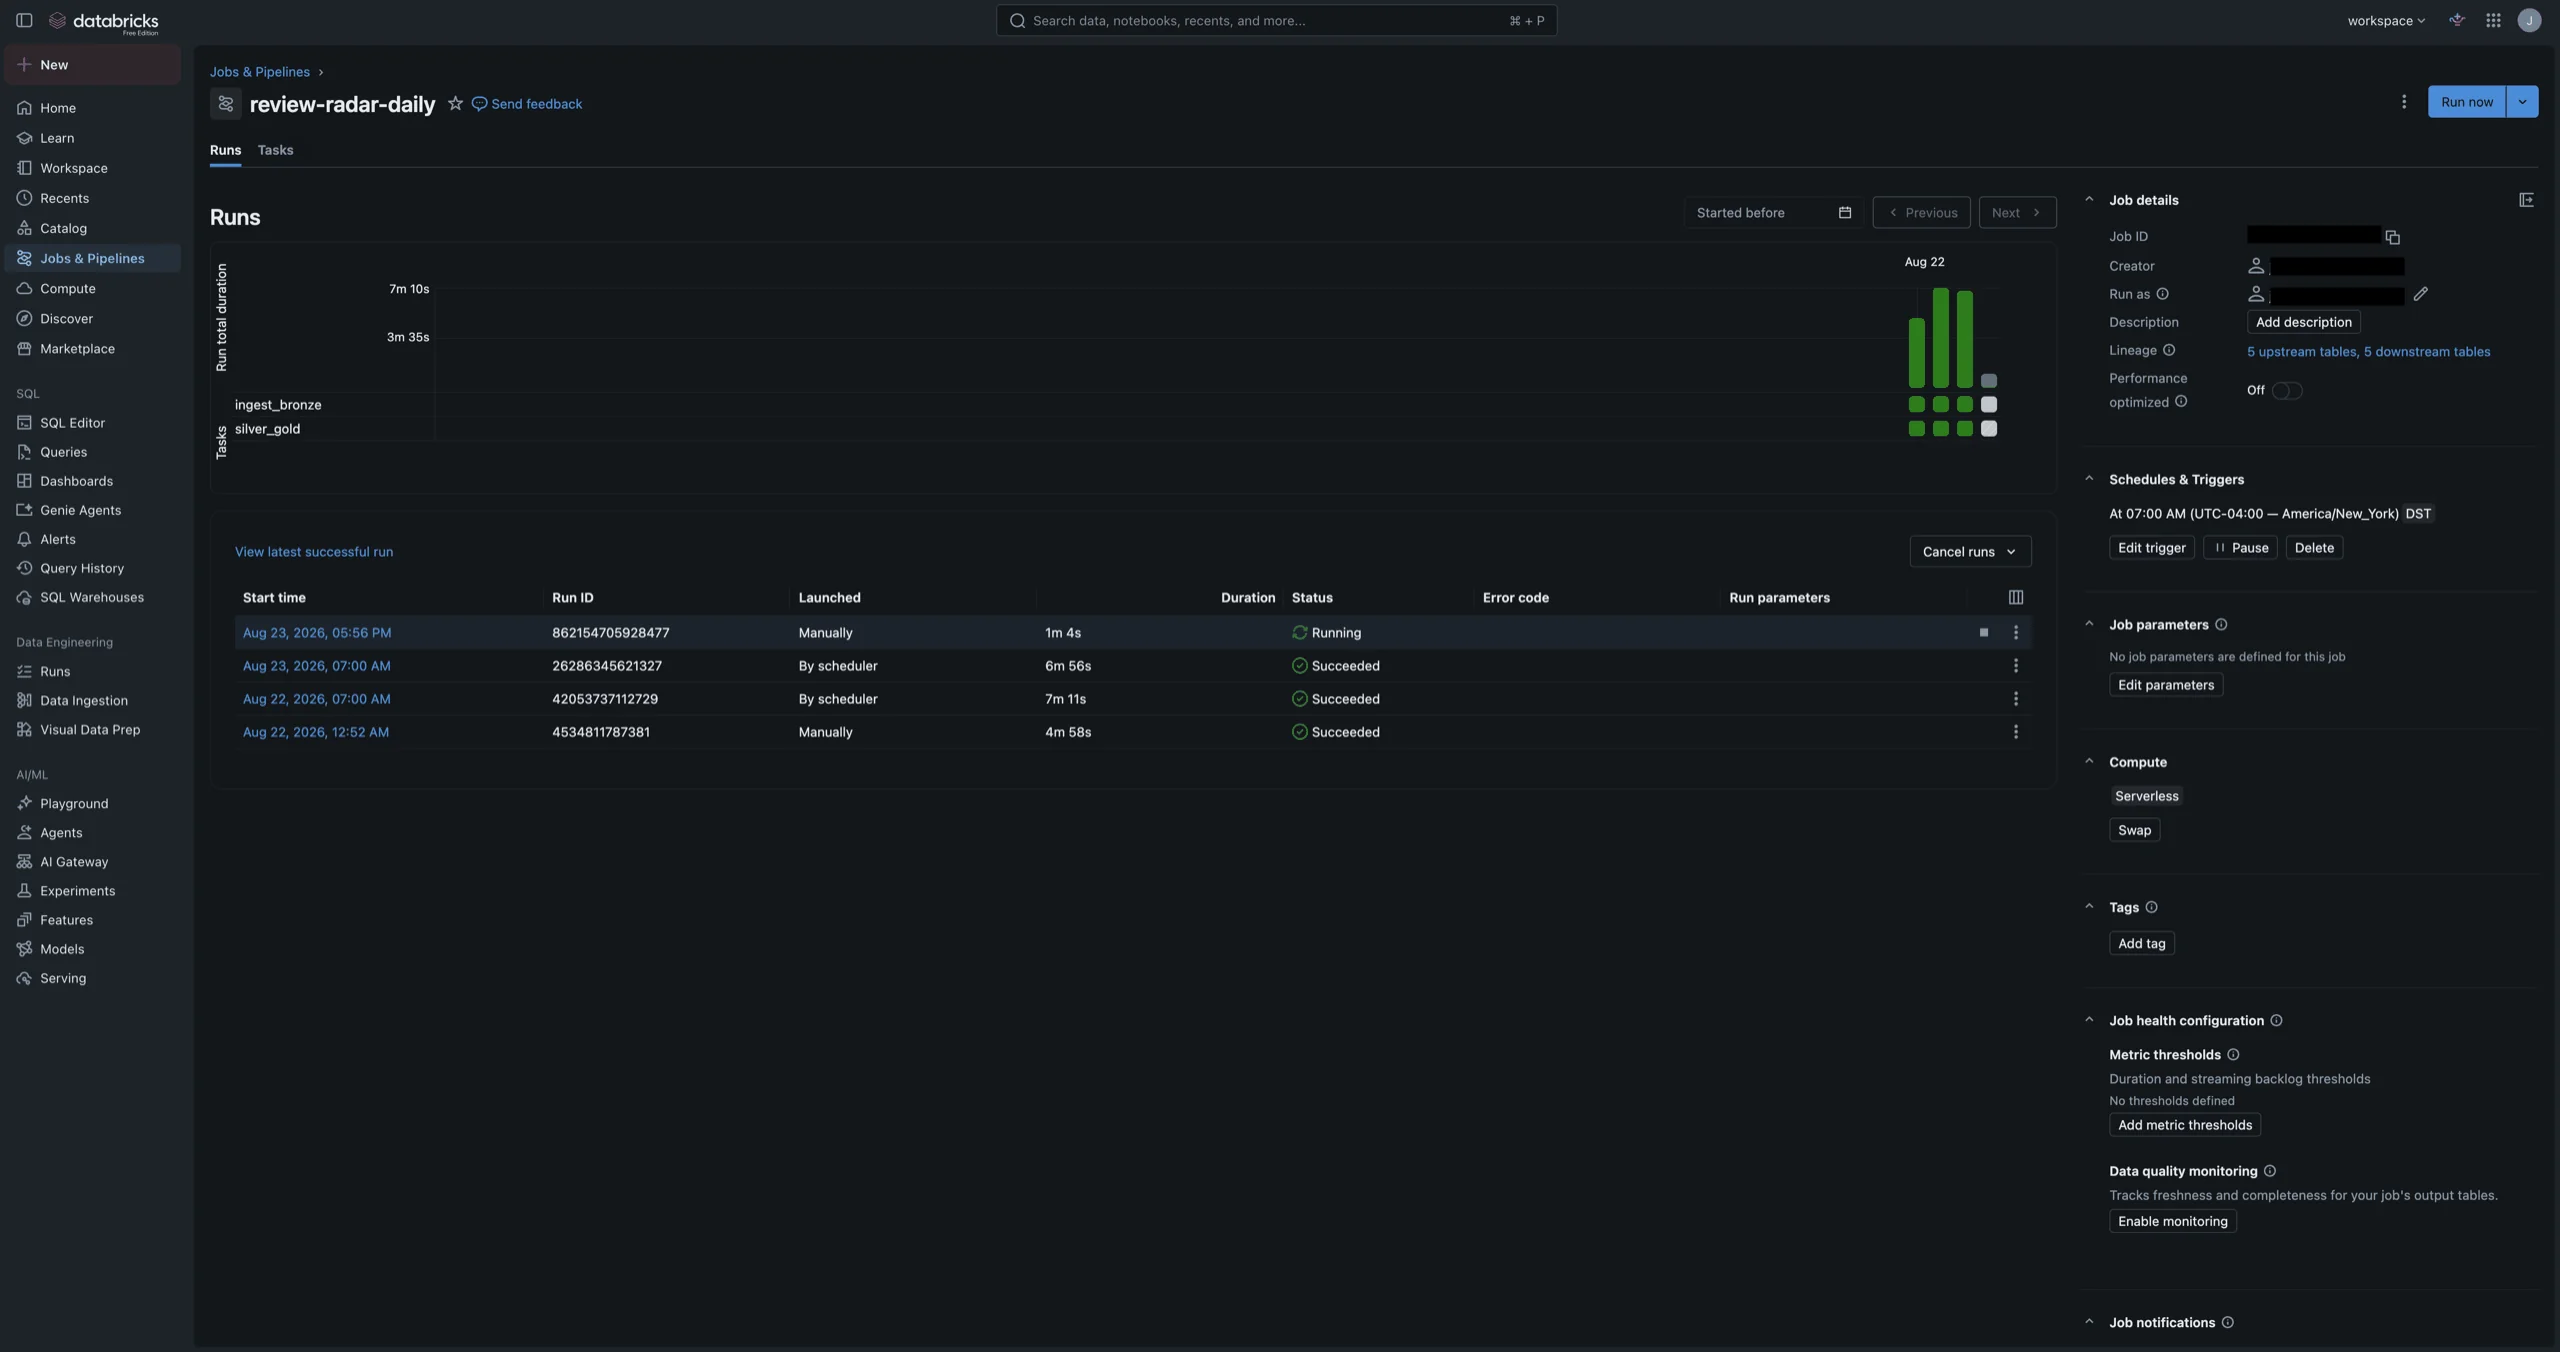
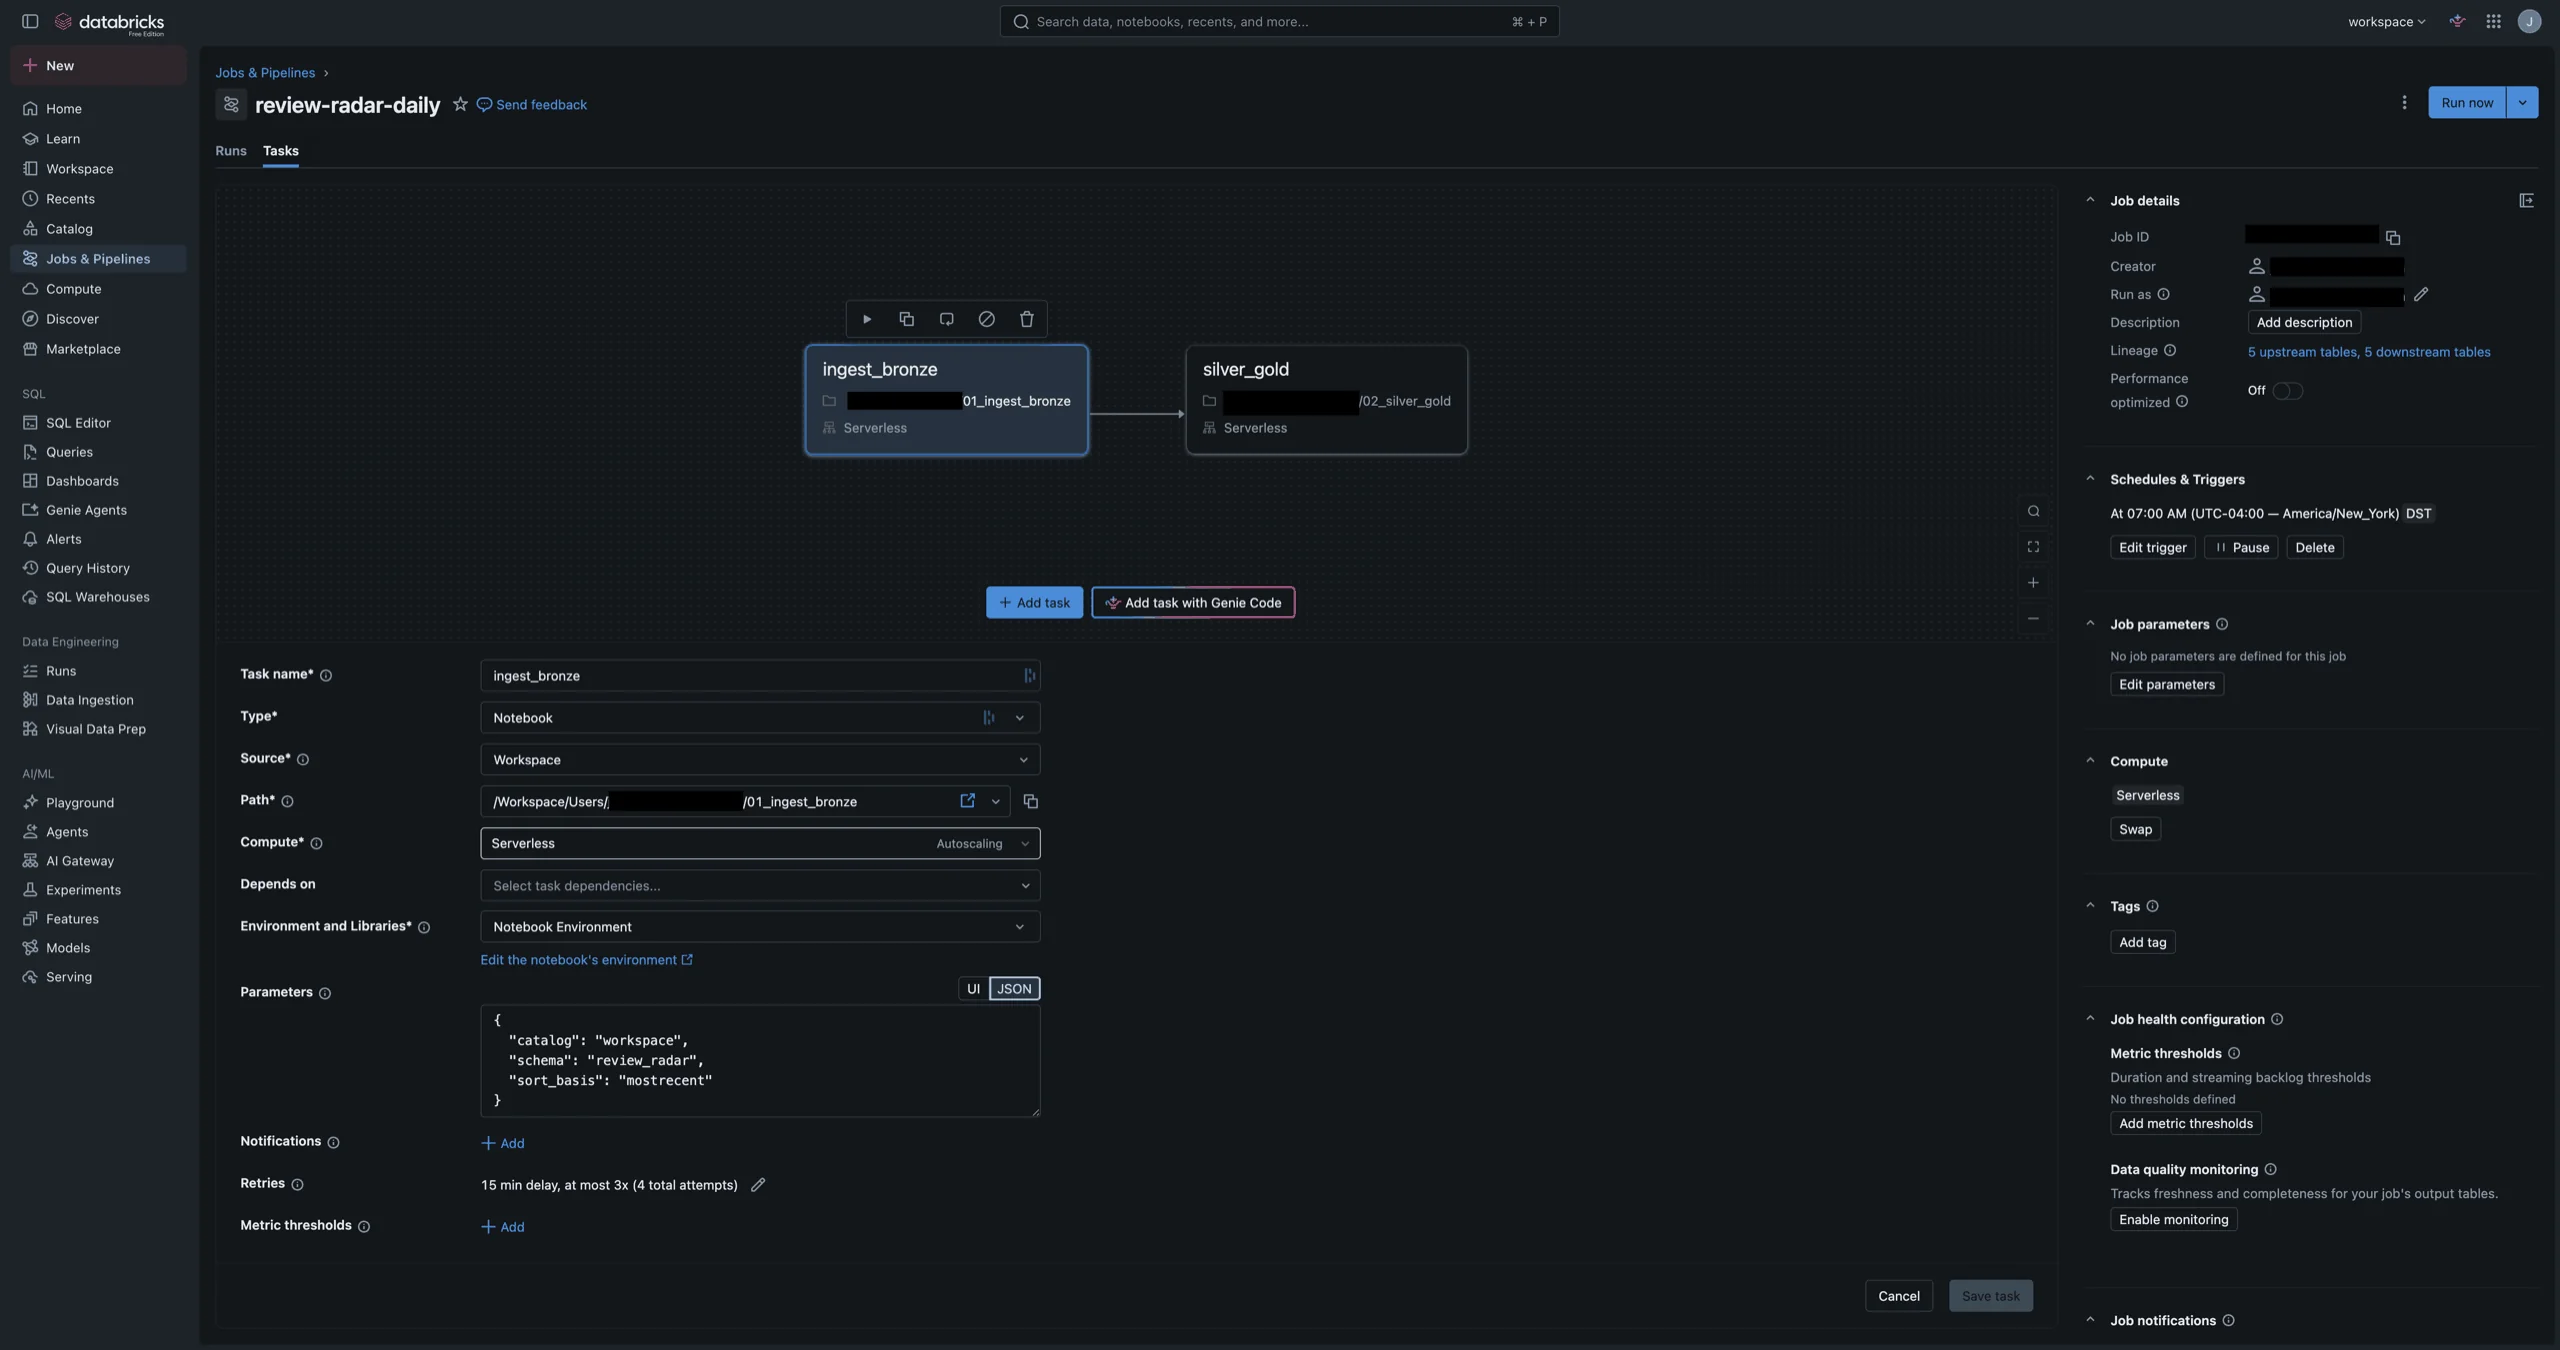
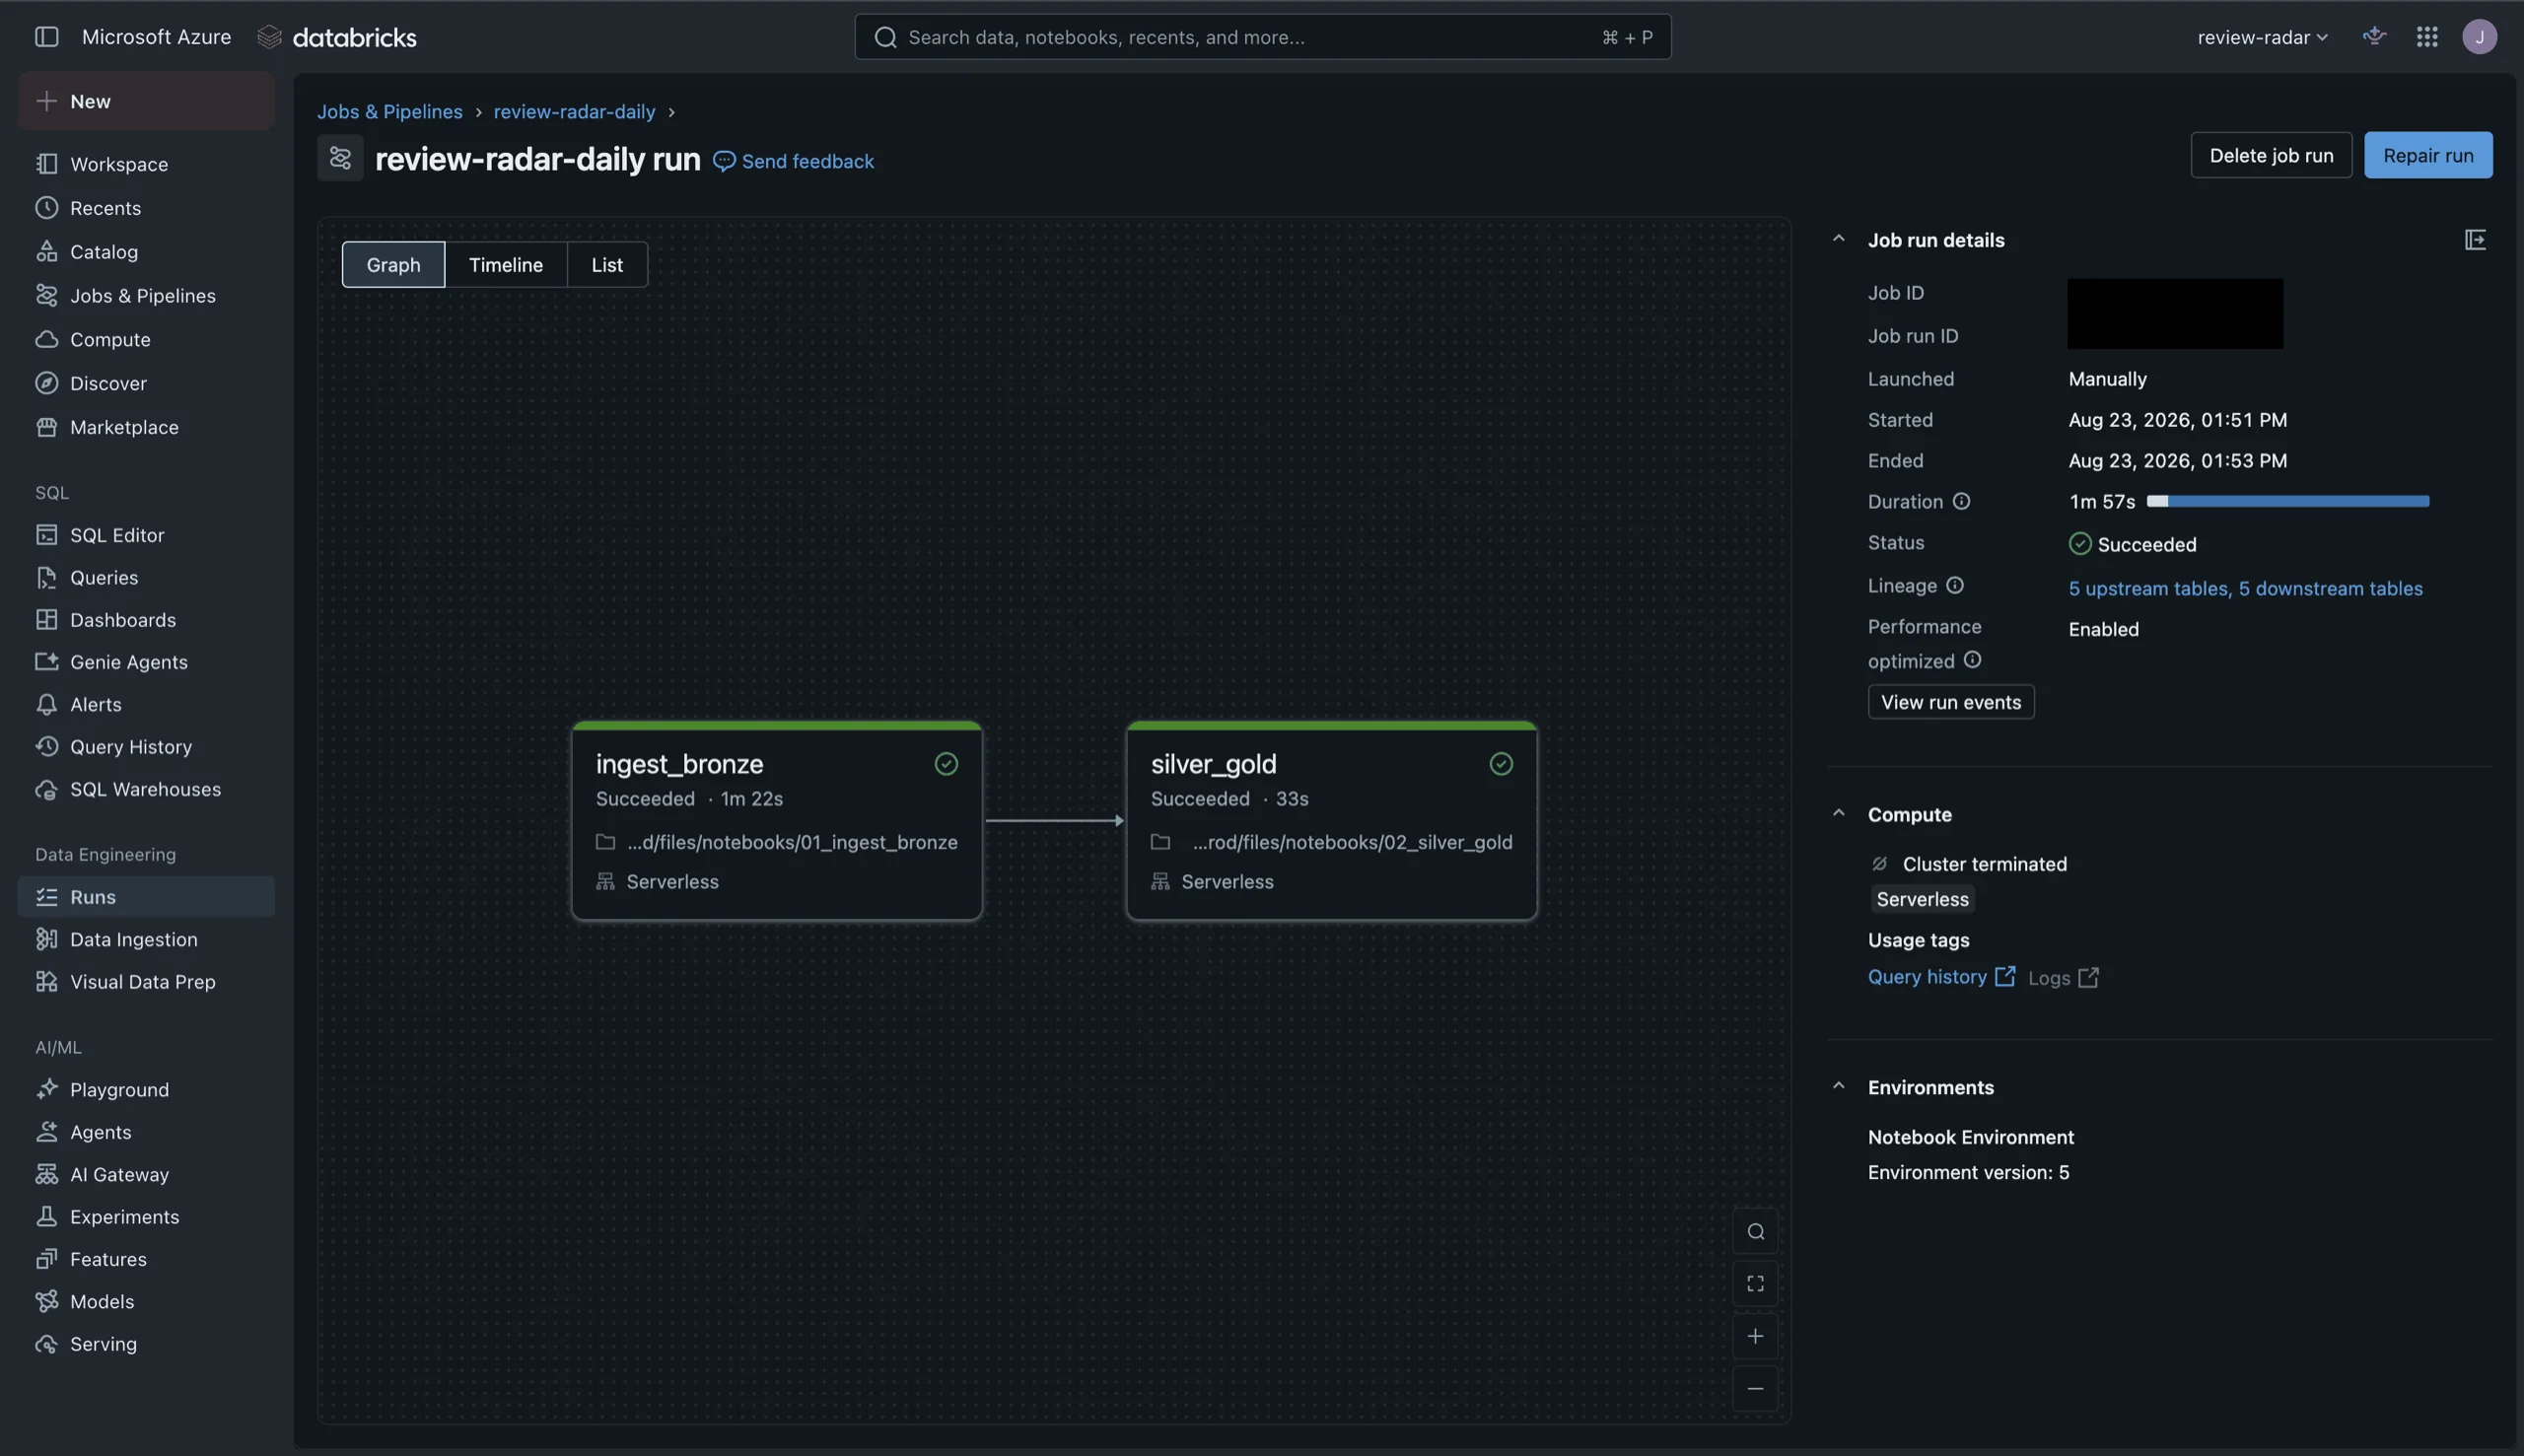
MERGEupsert keyed on review id (App Store reviews are editable), then the first gold aggregates. - Stage 3: Two-task Lakeflow job on serverless compute, scheduled daily with retries and failure alerts.
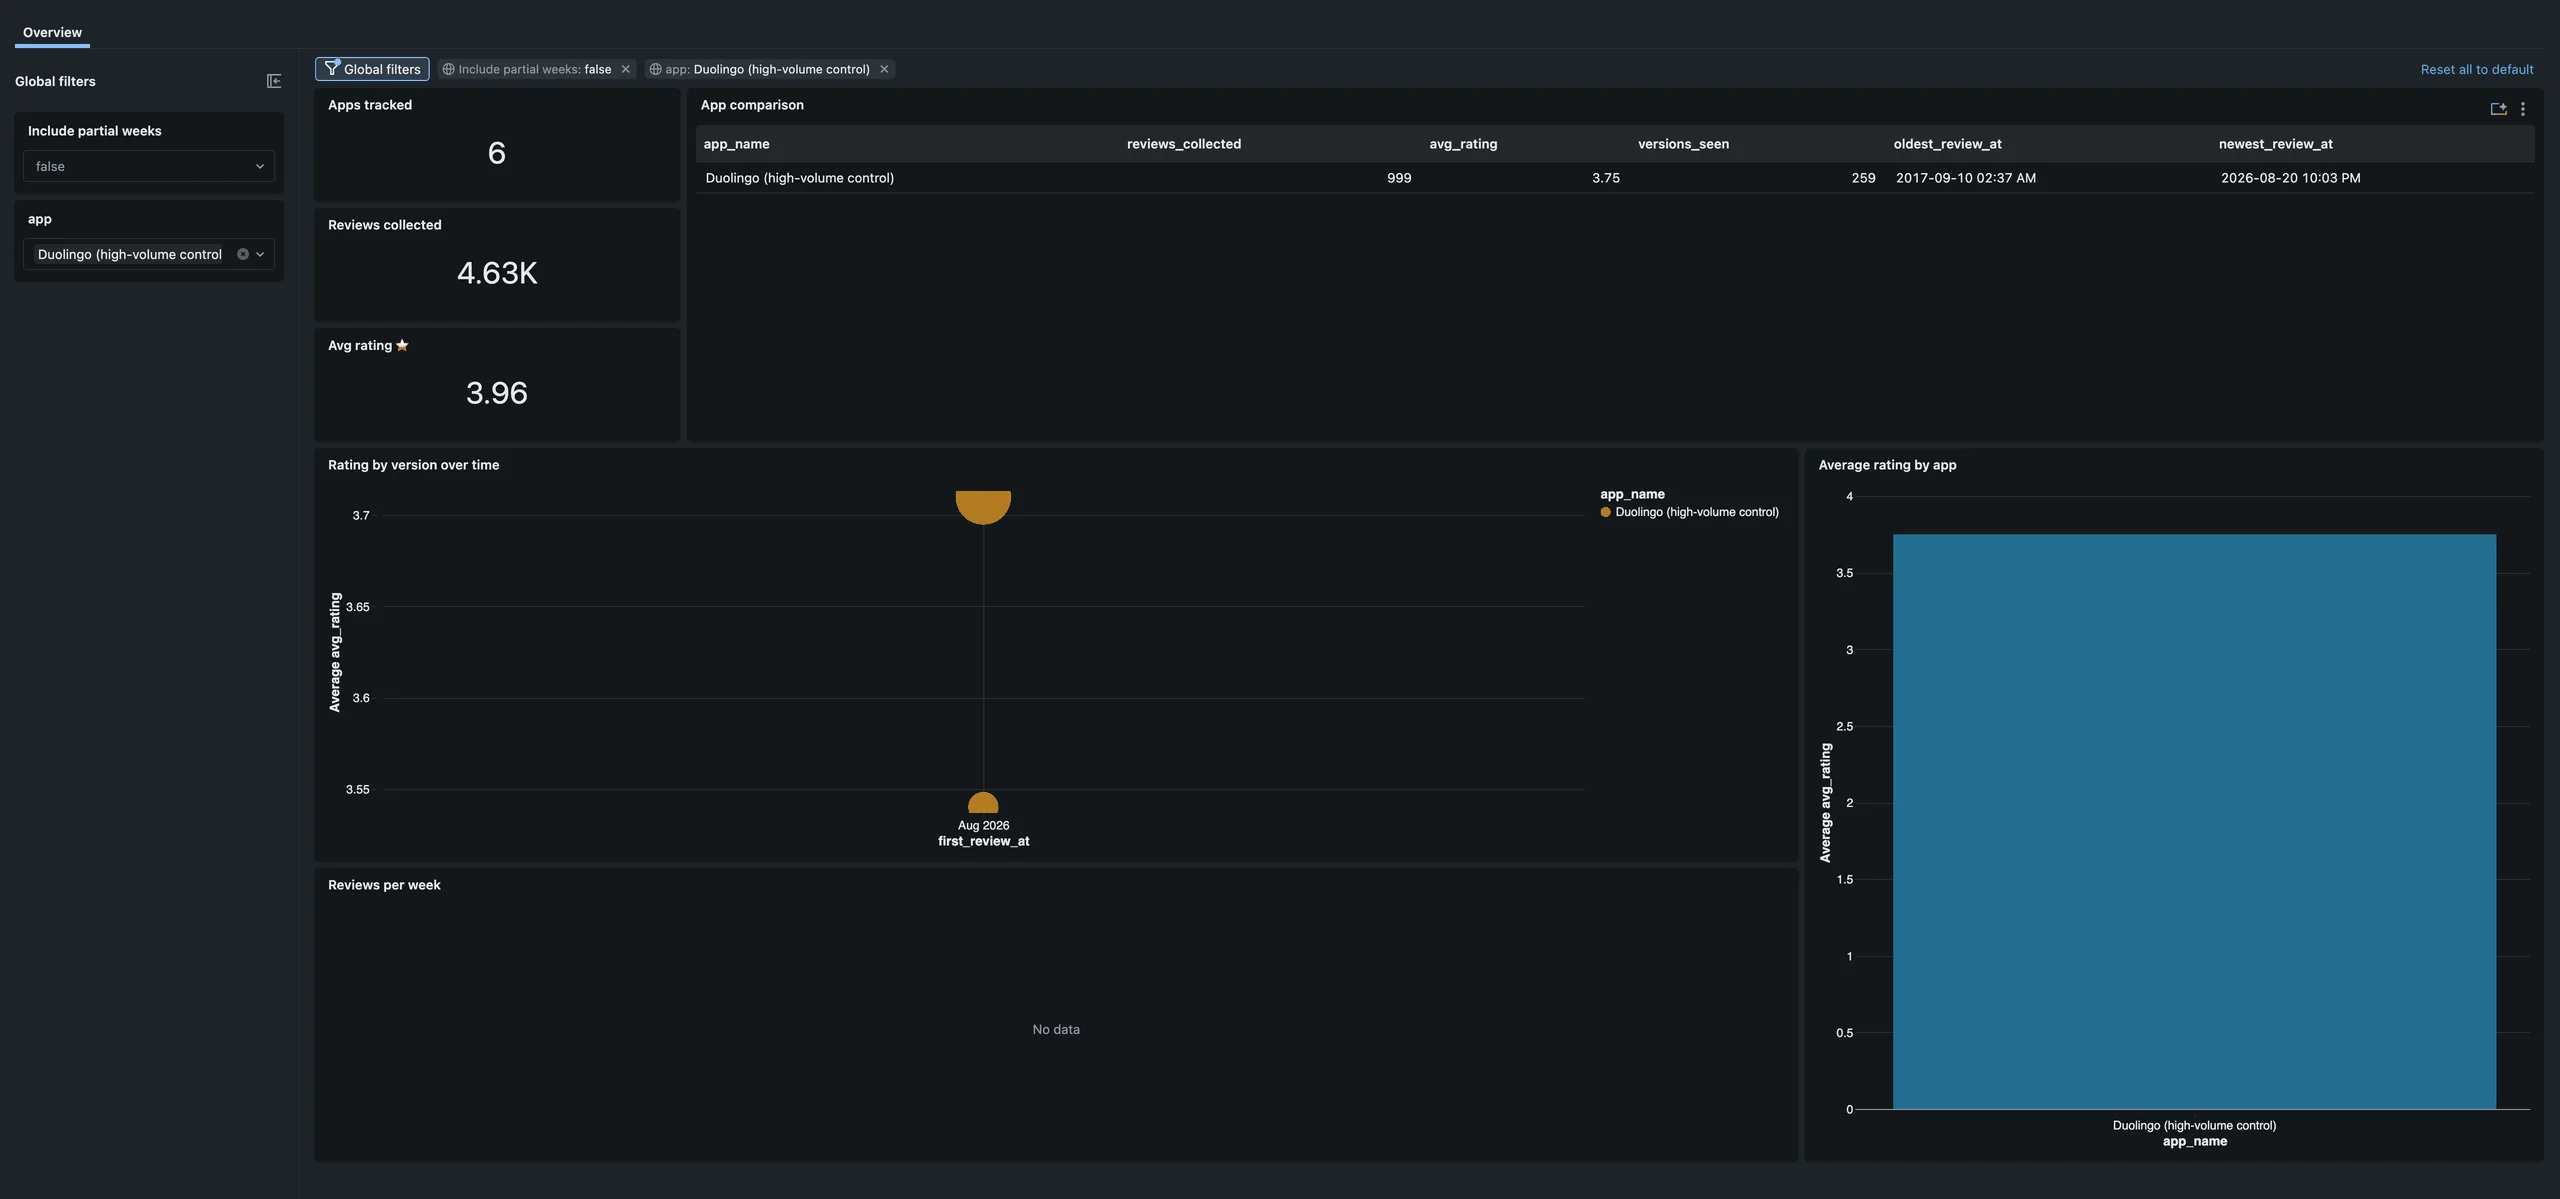
- Stage 4: AI/BI dashboard — rating by version, weekly velocity, competitor comparison.
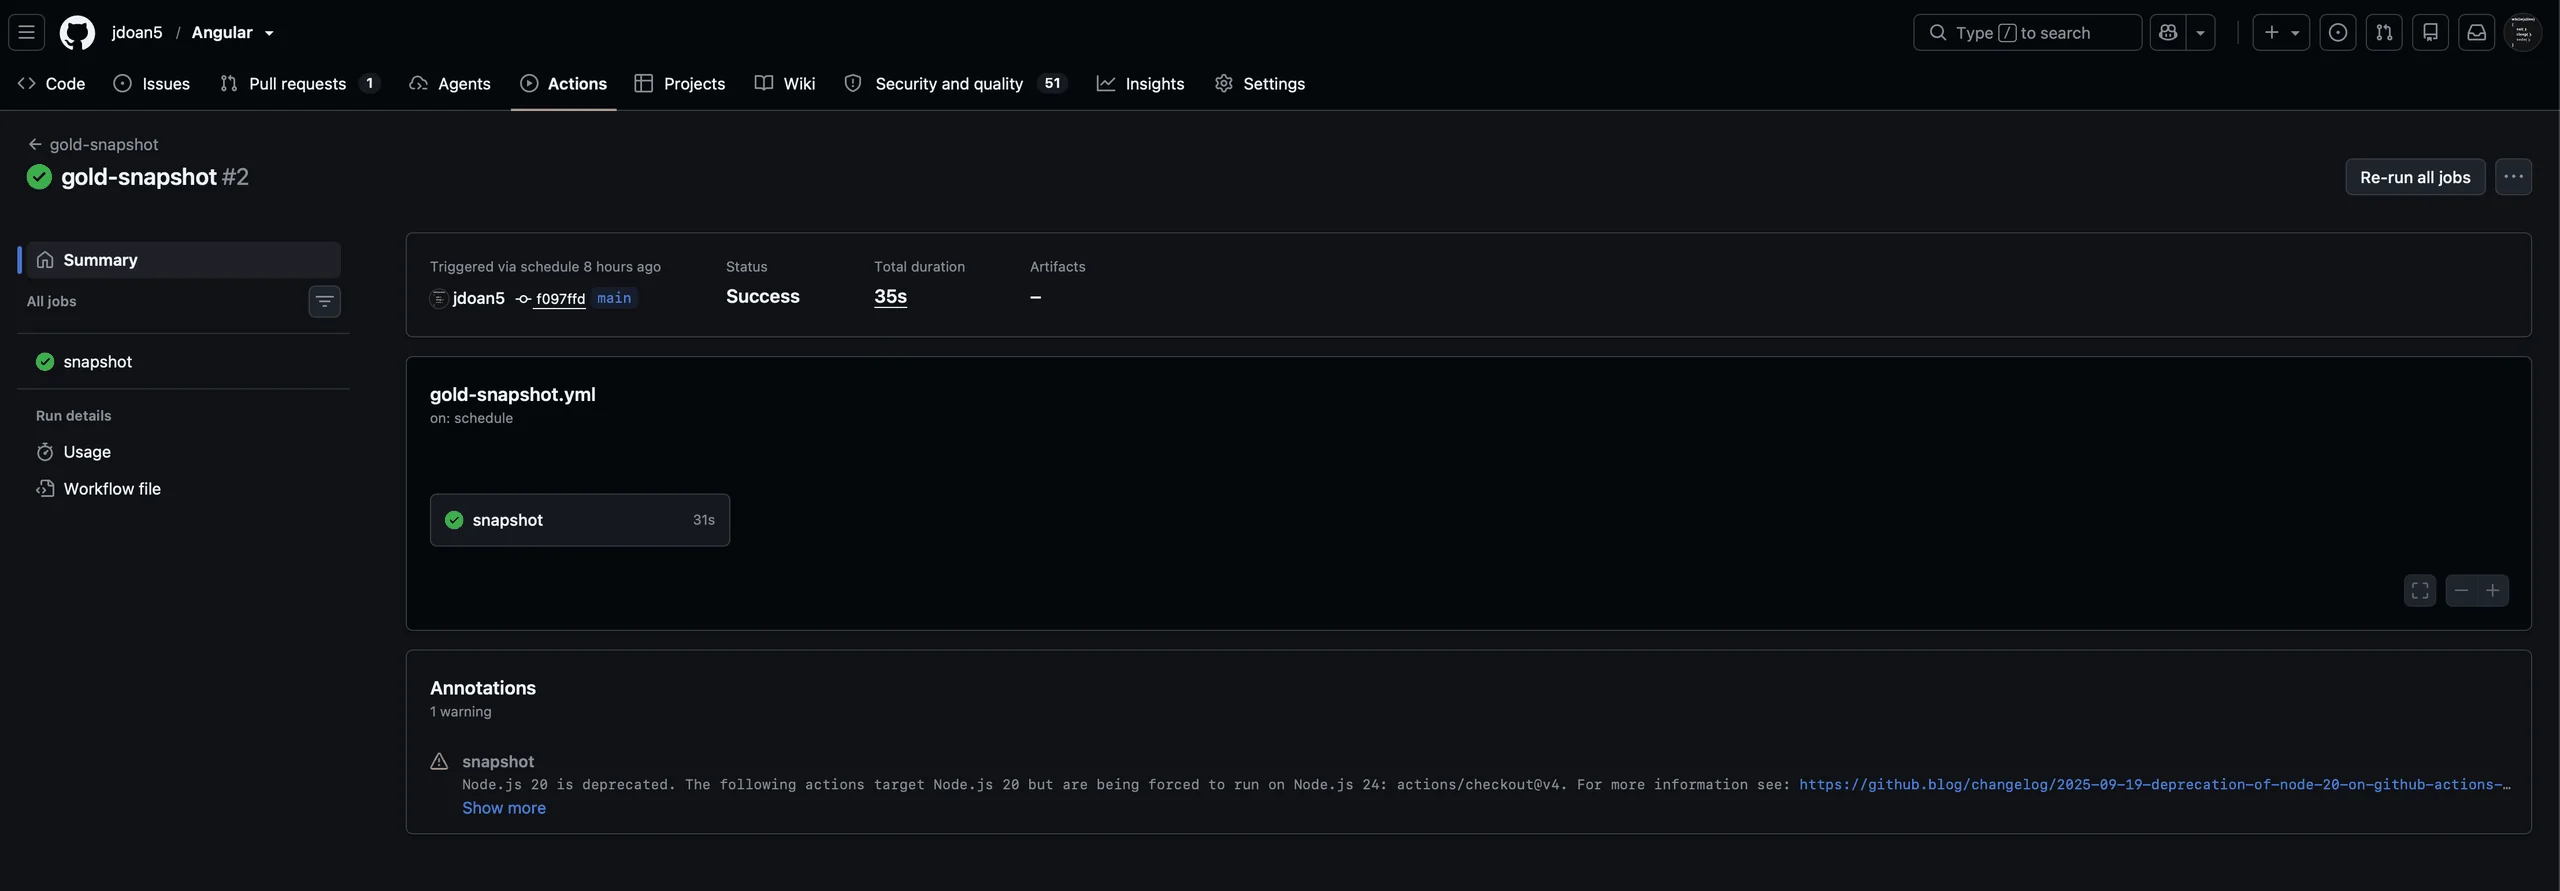
- Stage 5: Databricks Asset Bundles (job deployed from code) and a GitHub Action that publishes a nightly JSON snapshot to a Vercel dashboard.
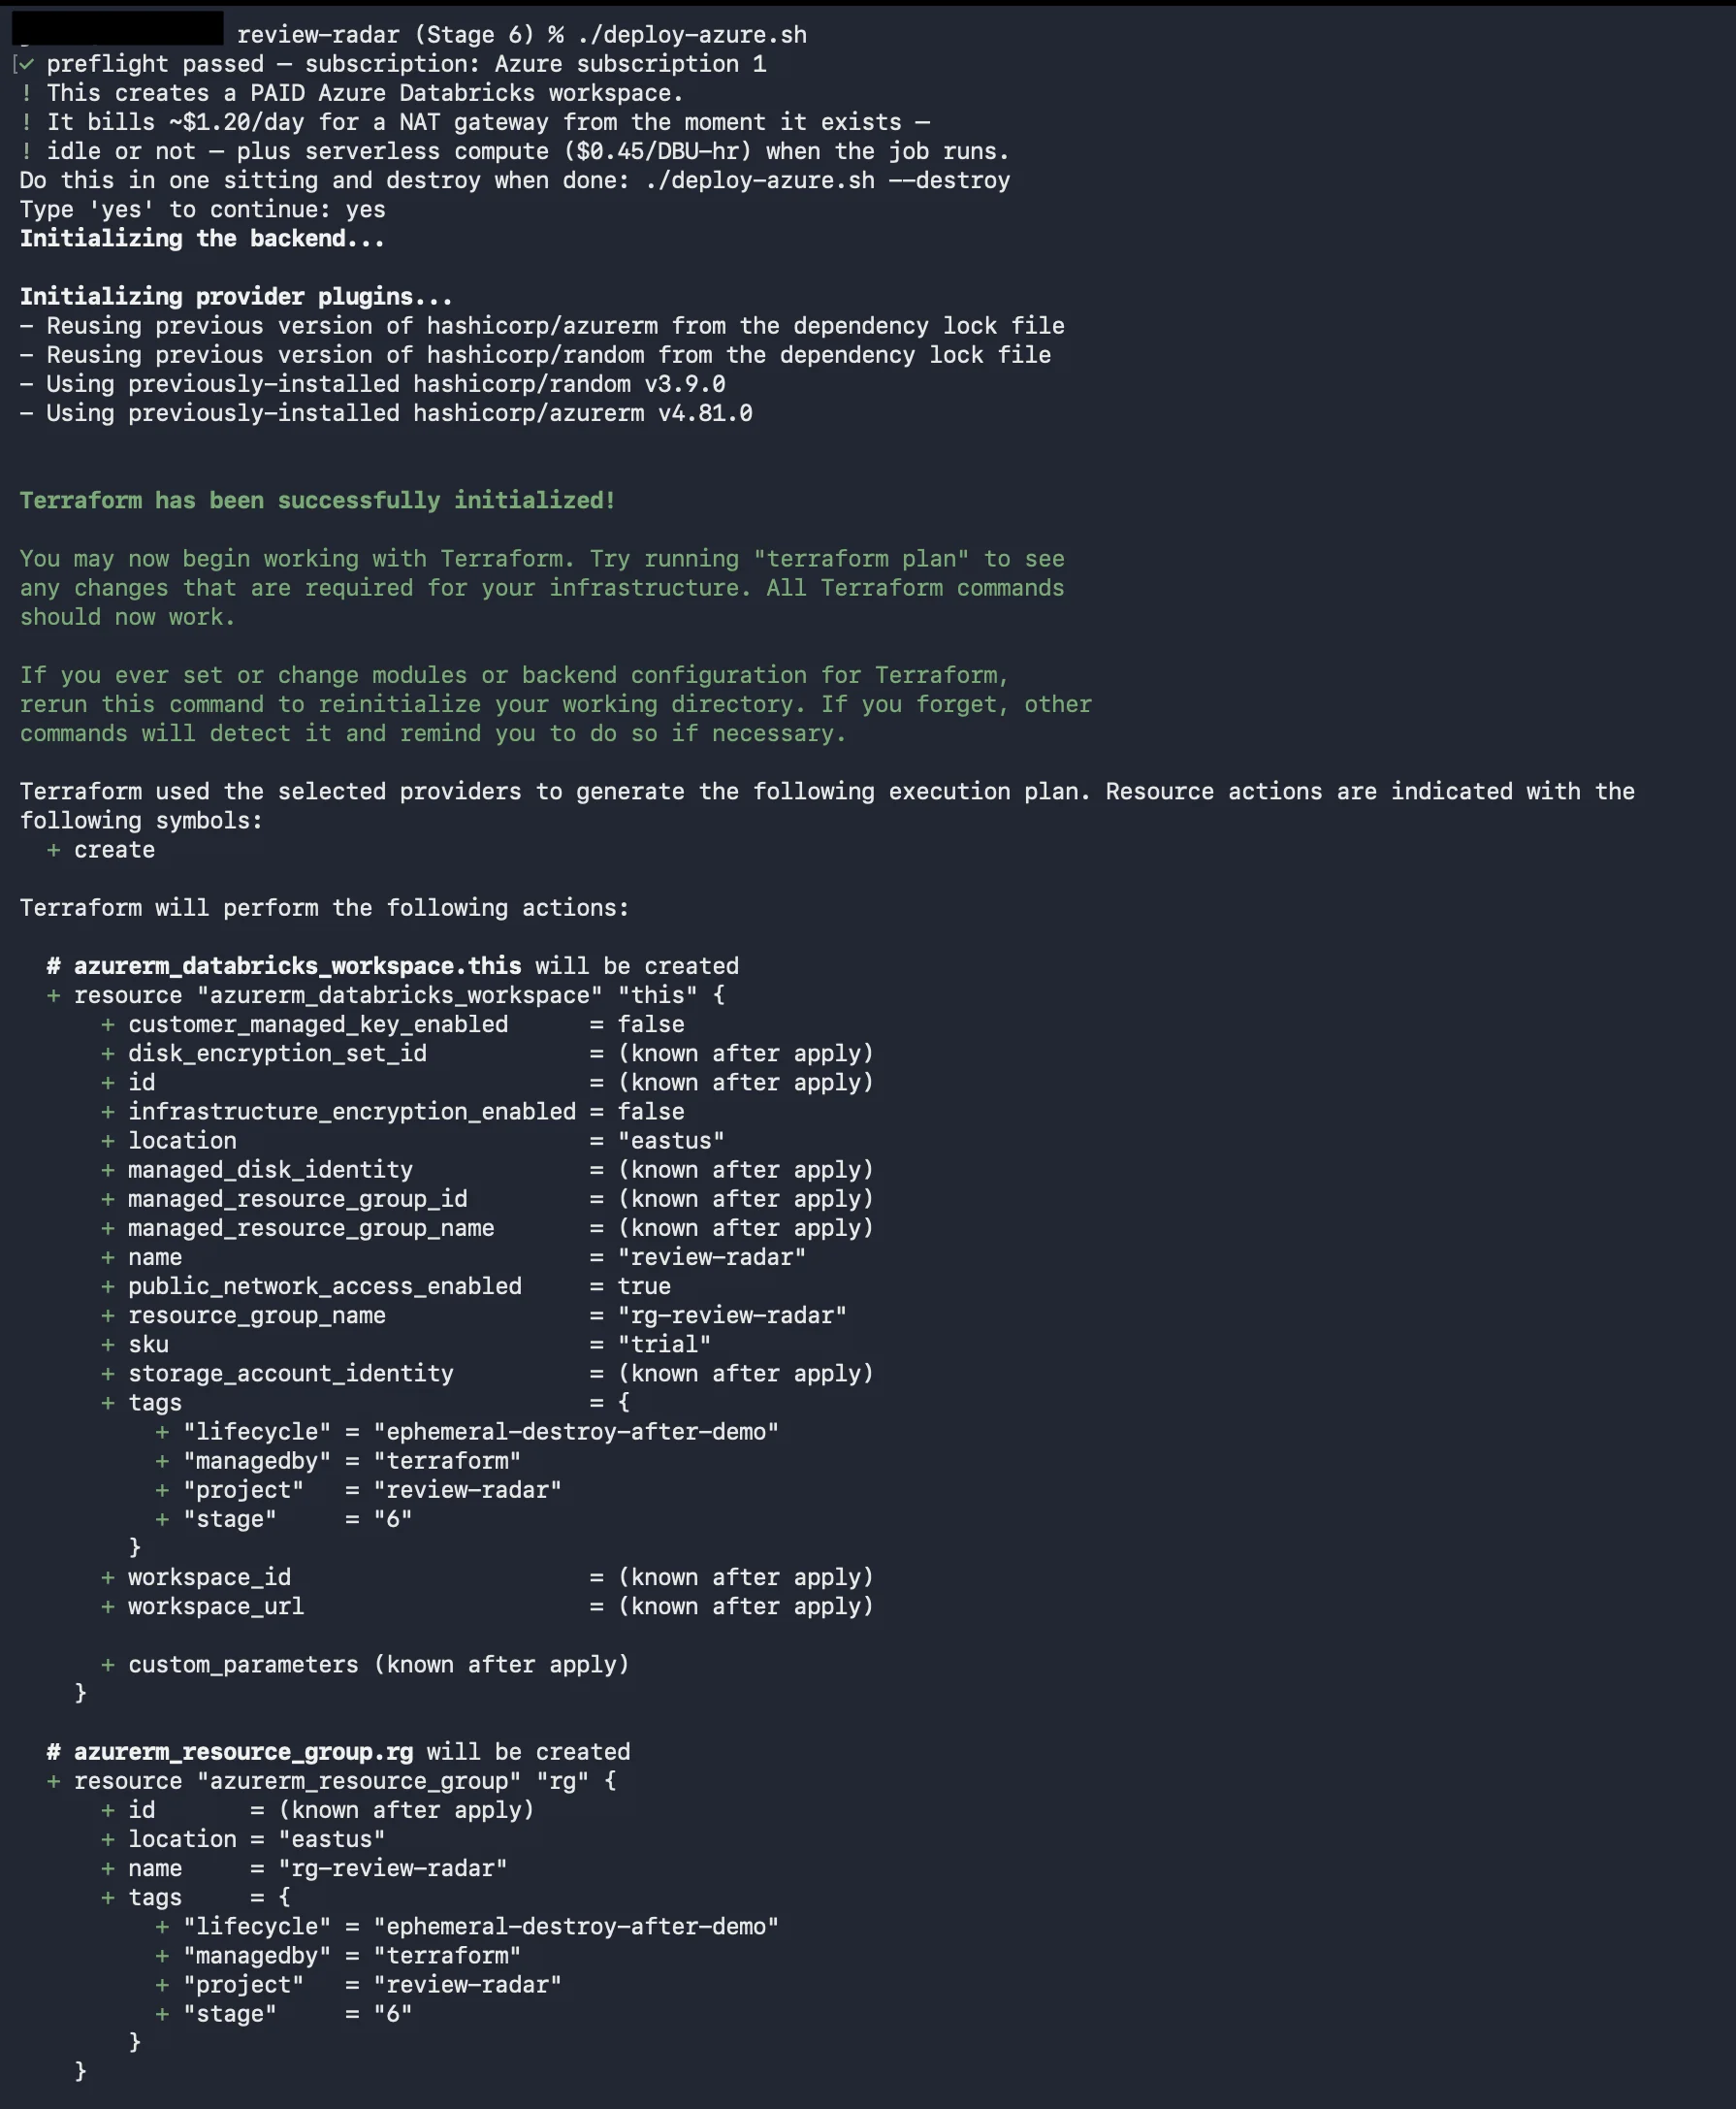
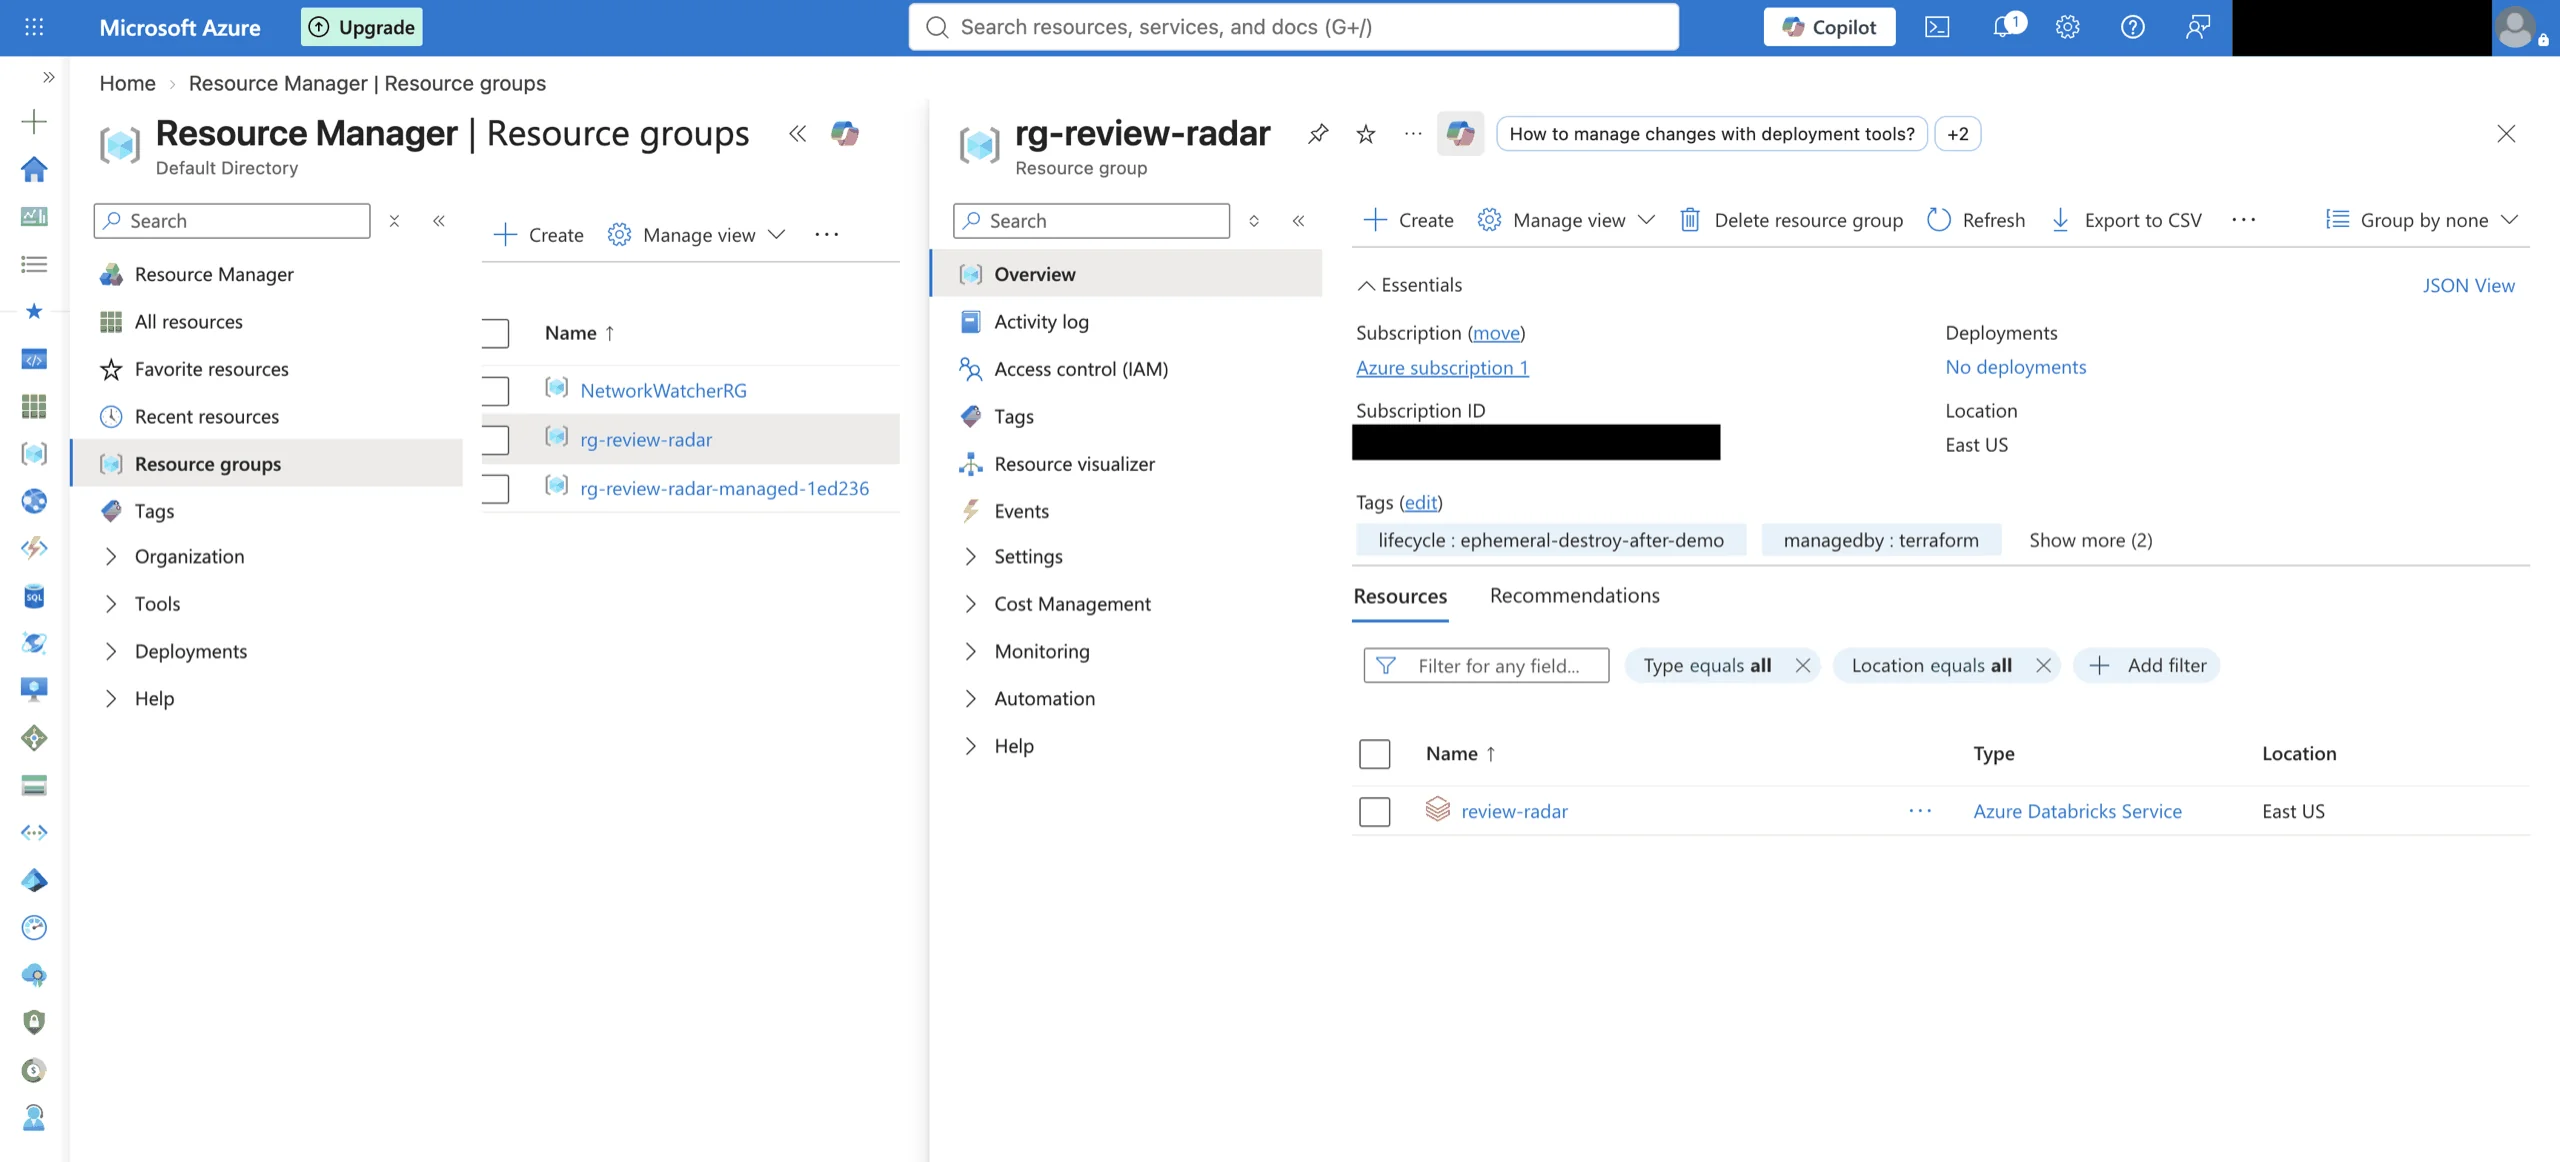
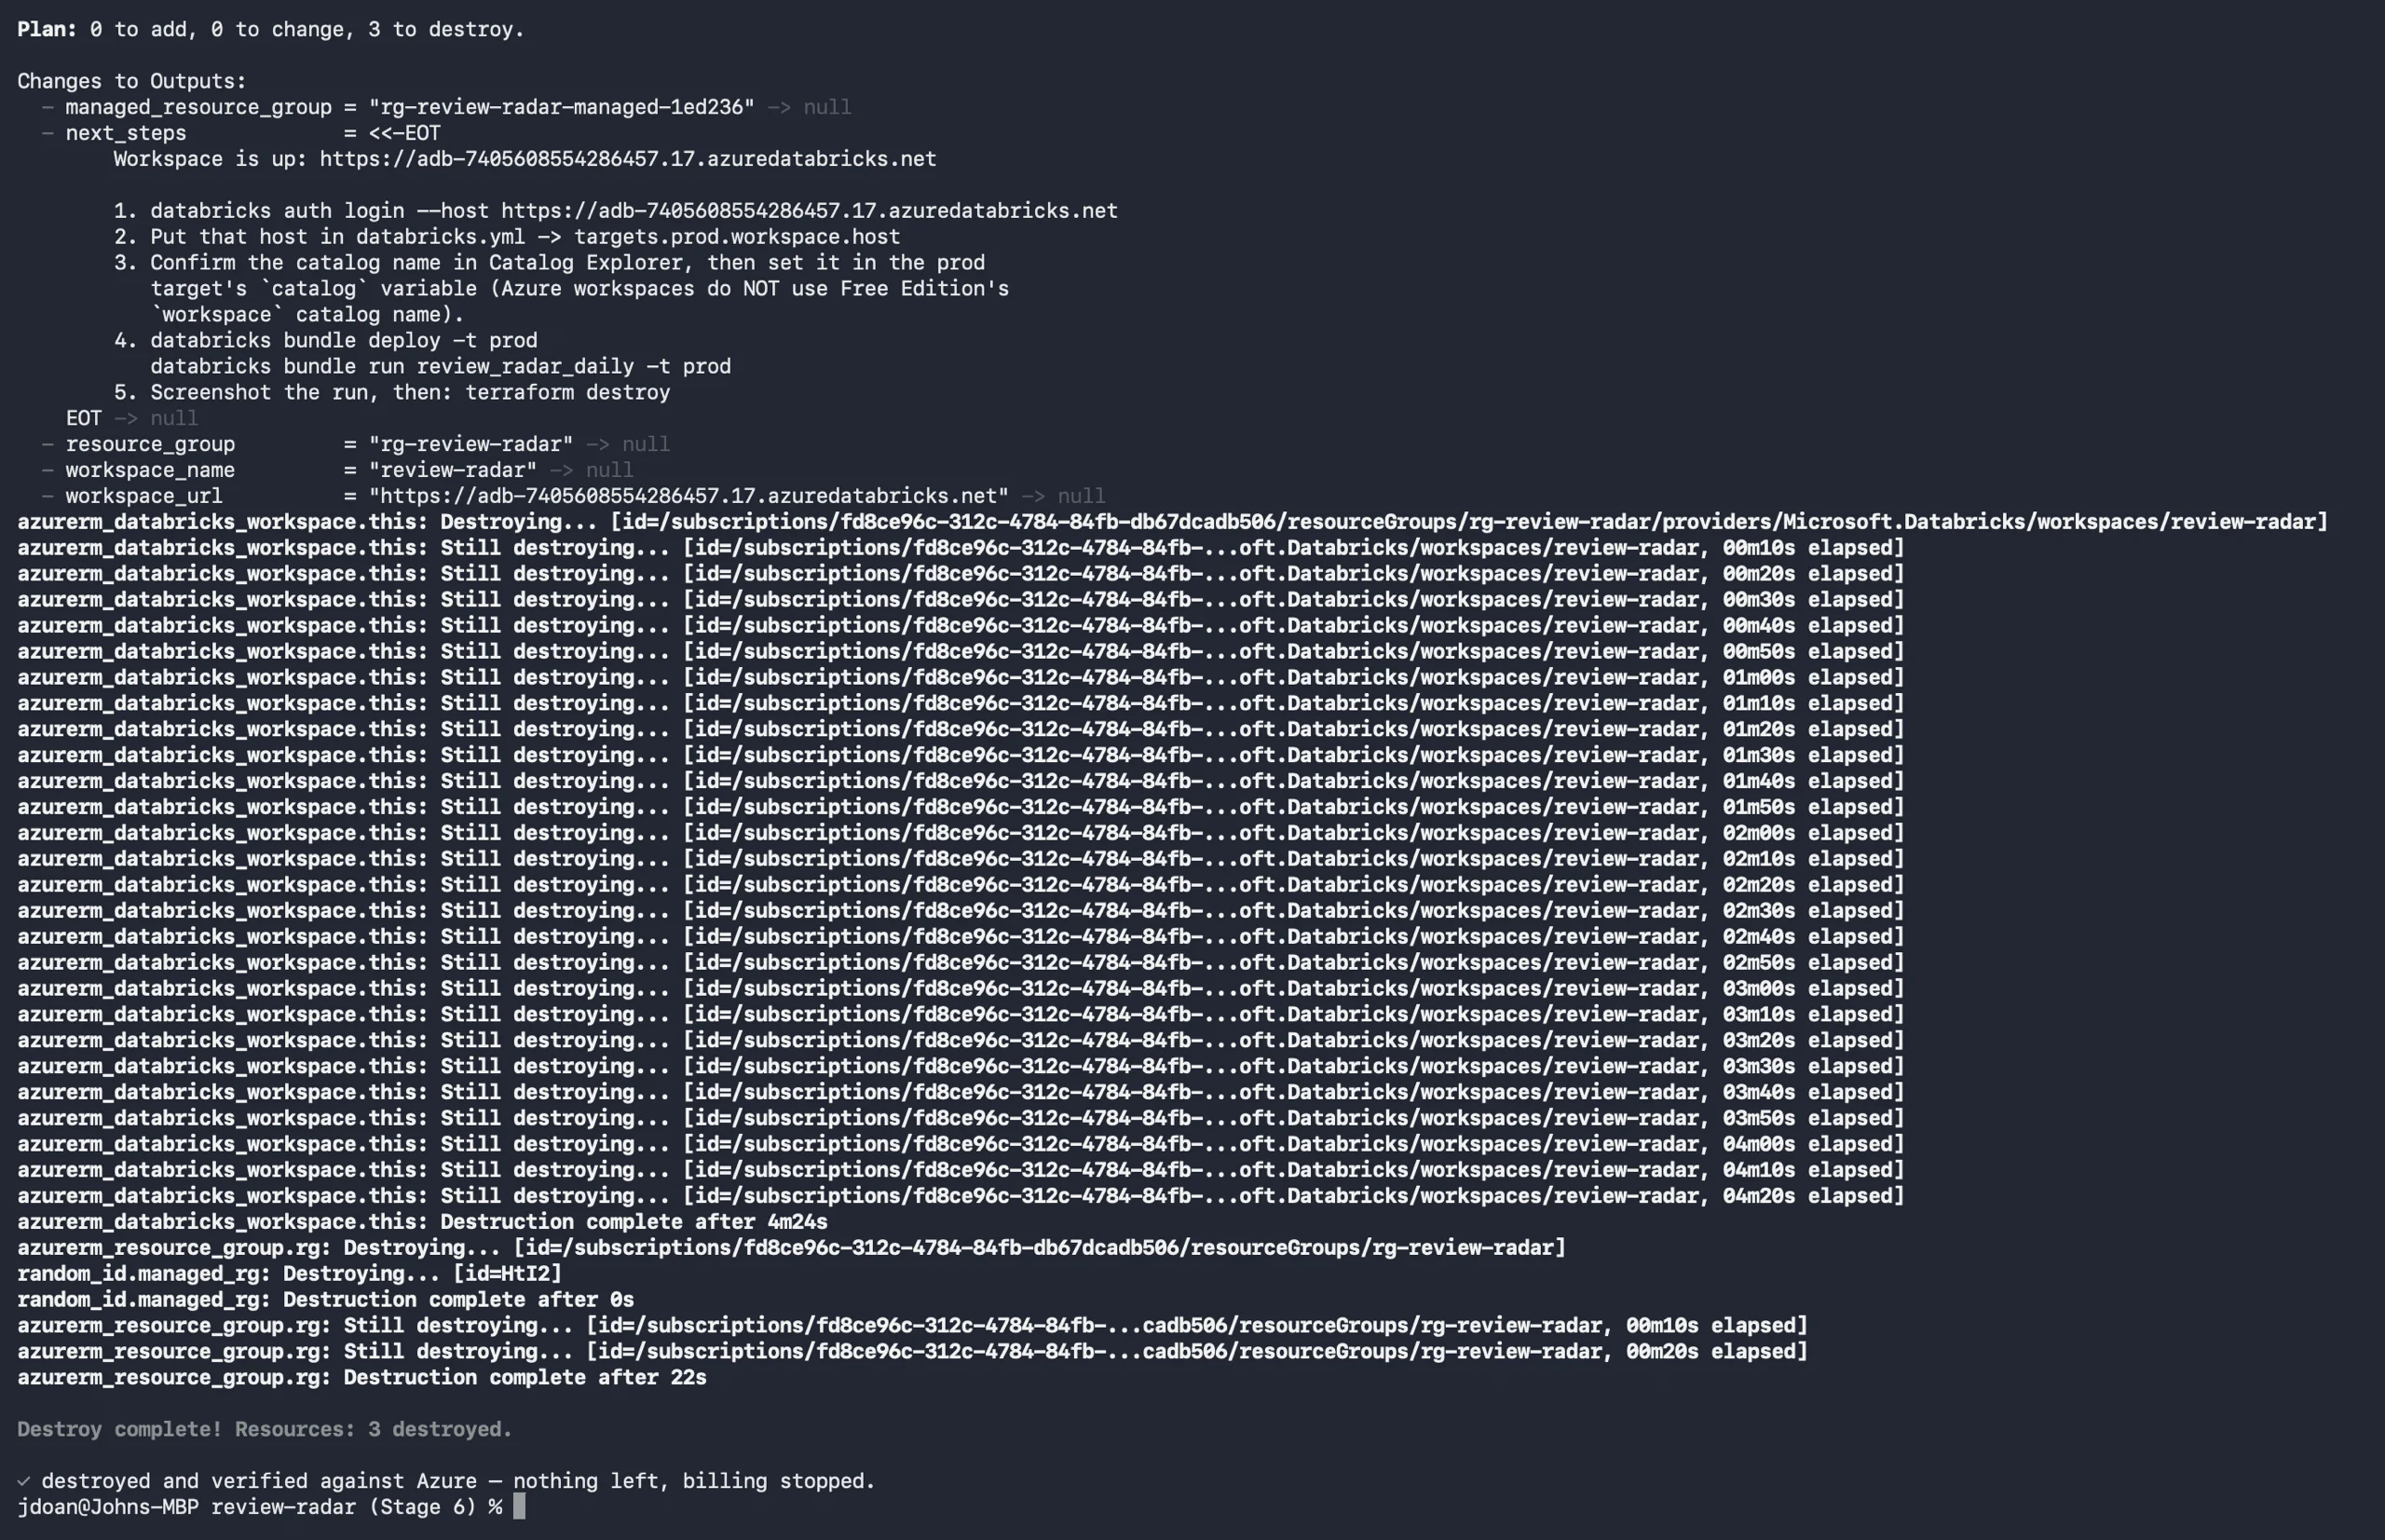
- Stage 6: Terraform an Azure Databricks workspace and deploy the same bundle to it — the pipeline was never tied to one platform. Provisioned, verified, screenshotted, and destroyed the same day, with the teardown checked against Azure rather than trusted.
Query Plan Forensics (PostgreSQL)
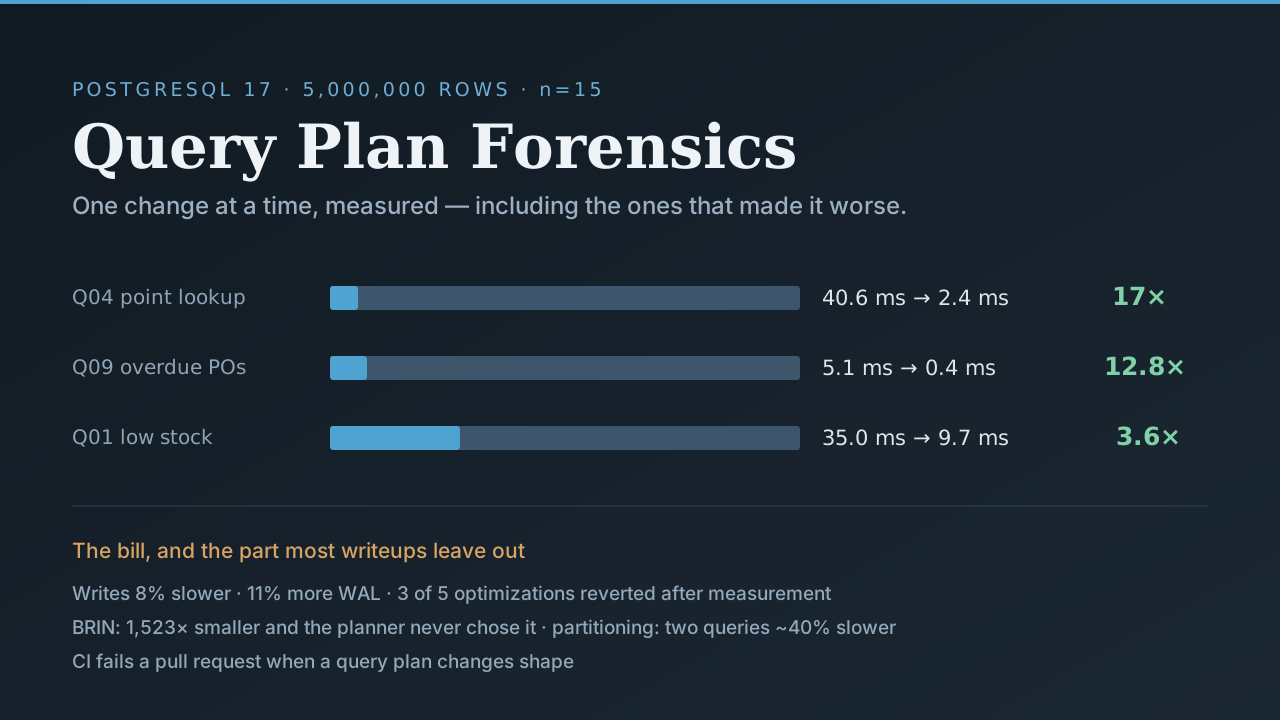
My own inventory schema scaled to five million rows with a fixed seed and deliberate skew, then tuned one change at a time and measured — including the three optimizations I reverted. A GitHub Action fails a pull request when a query plan changes shape.
- Stage 0–1: Postgres 17 pinned in Docker with every planner GUC in git and checksums on at
initdb; a generator withsetseed, a power-law over SKUs, and physical ordering bycreated_at— the load-time decision that determines which index types exist two stages later. - Stage 2: Benchmark harness reading
Execution Timeout of theEXPLAINJSON rather than timing the client, round-robin iterations to spread thermal drift, and a coefficient-of-variation warning when the numbers stop being defensible. - Stage 3: Indexing one change at a time — composite vs. covering, the partial index that works and the one Postgres refuses to build, BRIN vs. B-tree. Q04 17×, Q09 12.8×, Q01 3.6×.
- Stage 4: The invoice — write amplification in time and WAL bytes, extended statistics that fixed a 6× estimate error and changed nothing, and a 34 MB index Stage 3 had silently made redundant.
- Stage 5: Monthly range partitioning, measured and reverted: two queries ~40% slower against a 7.6% win on the one it was built for.
- Stage 6: Materializing the valuation — 5,118× faster reads, a break-even of 0.84 reads, and the conclusion that compute cost is a rounding error so the whole decision is staleness.
- Stage 7: A CI gate that compares plan shape and estimated cost — never wall-clock — and fails the PR when a “cleaner” query rewrite kills an index.
Mini Data Mart (DuckDB)
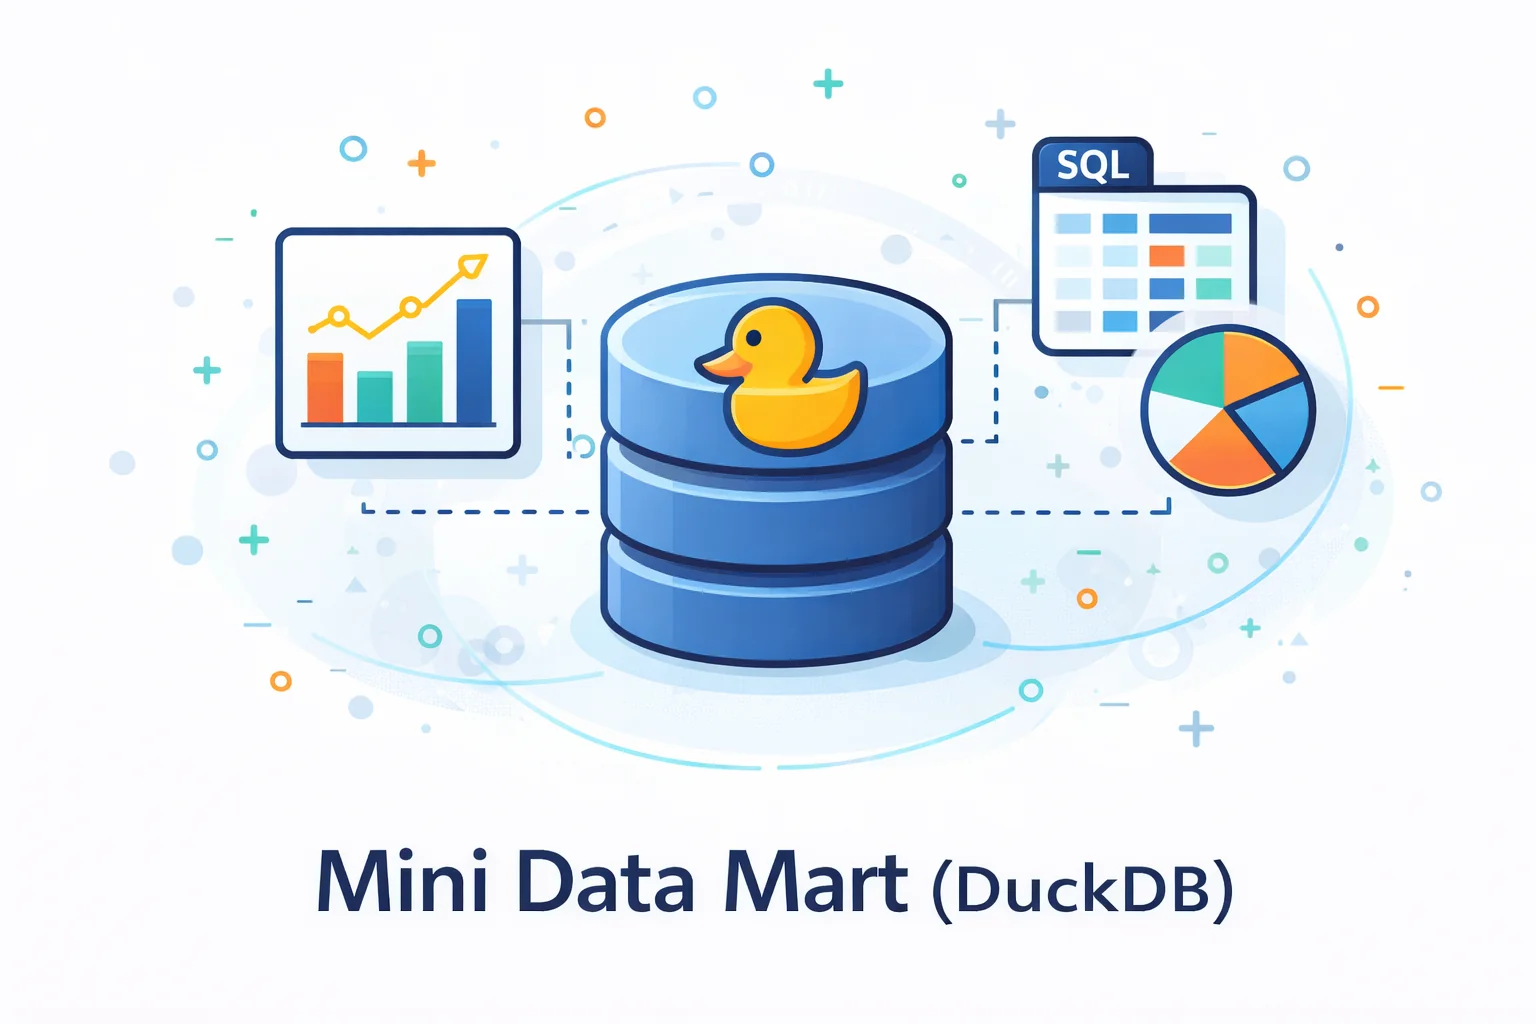
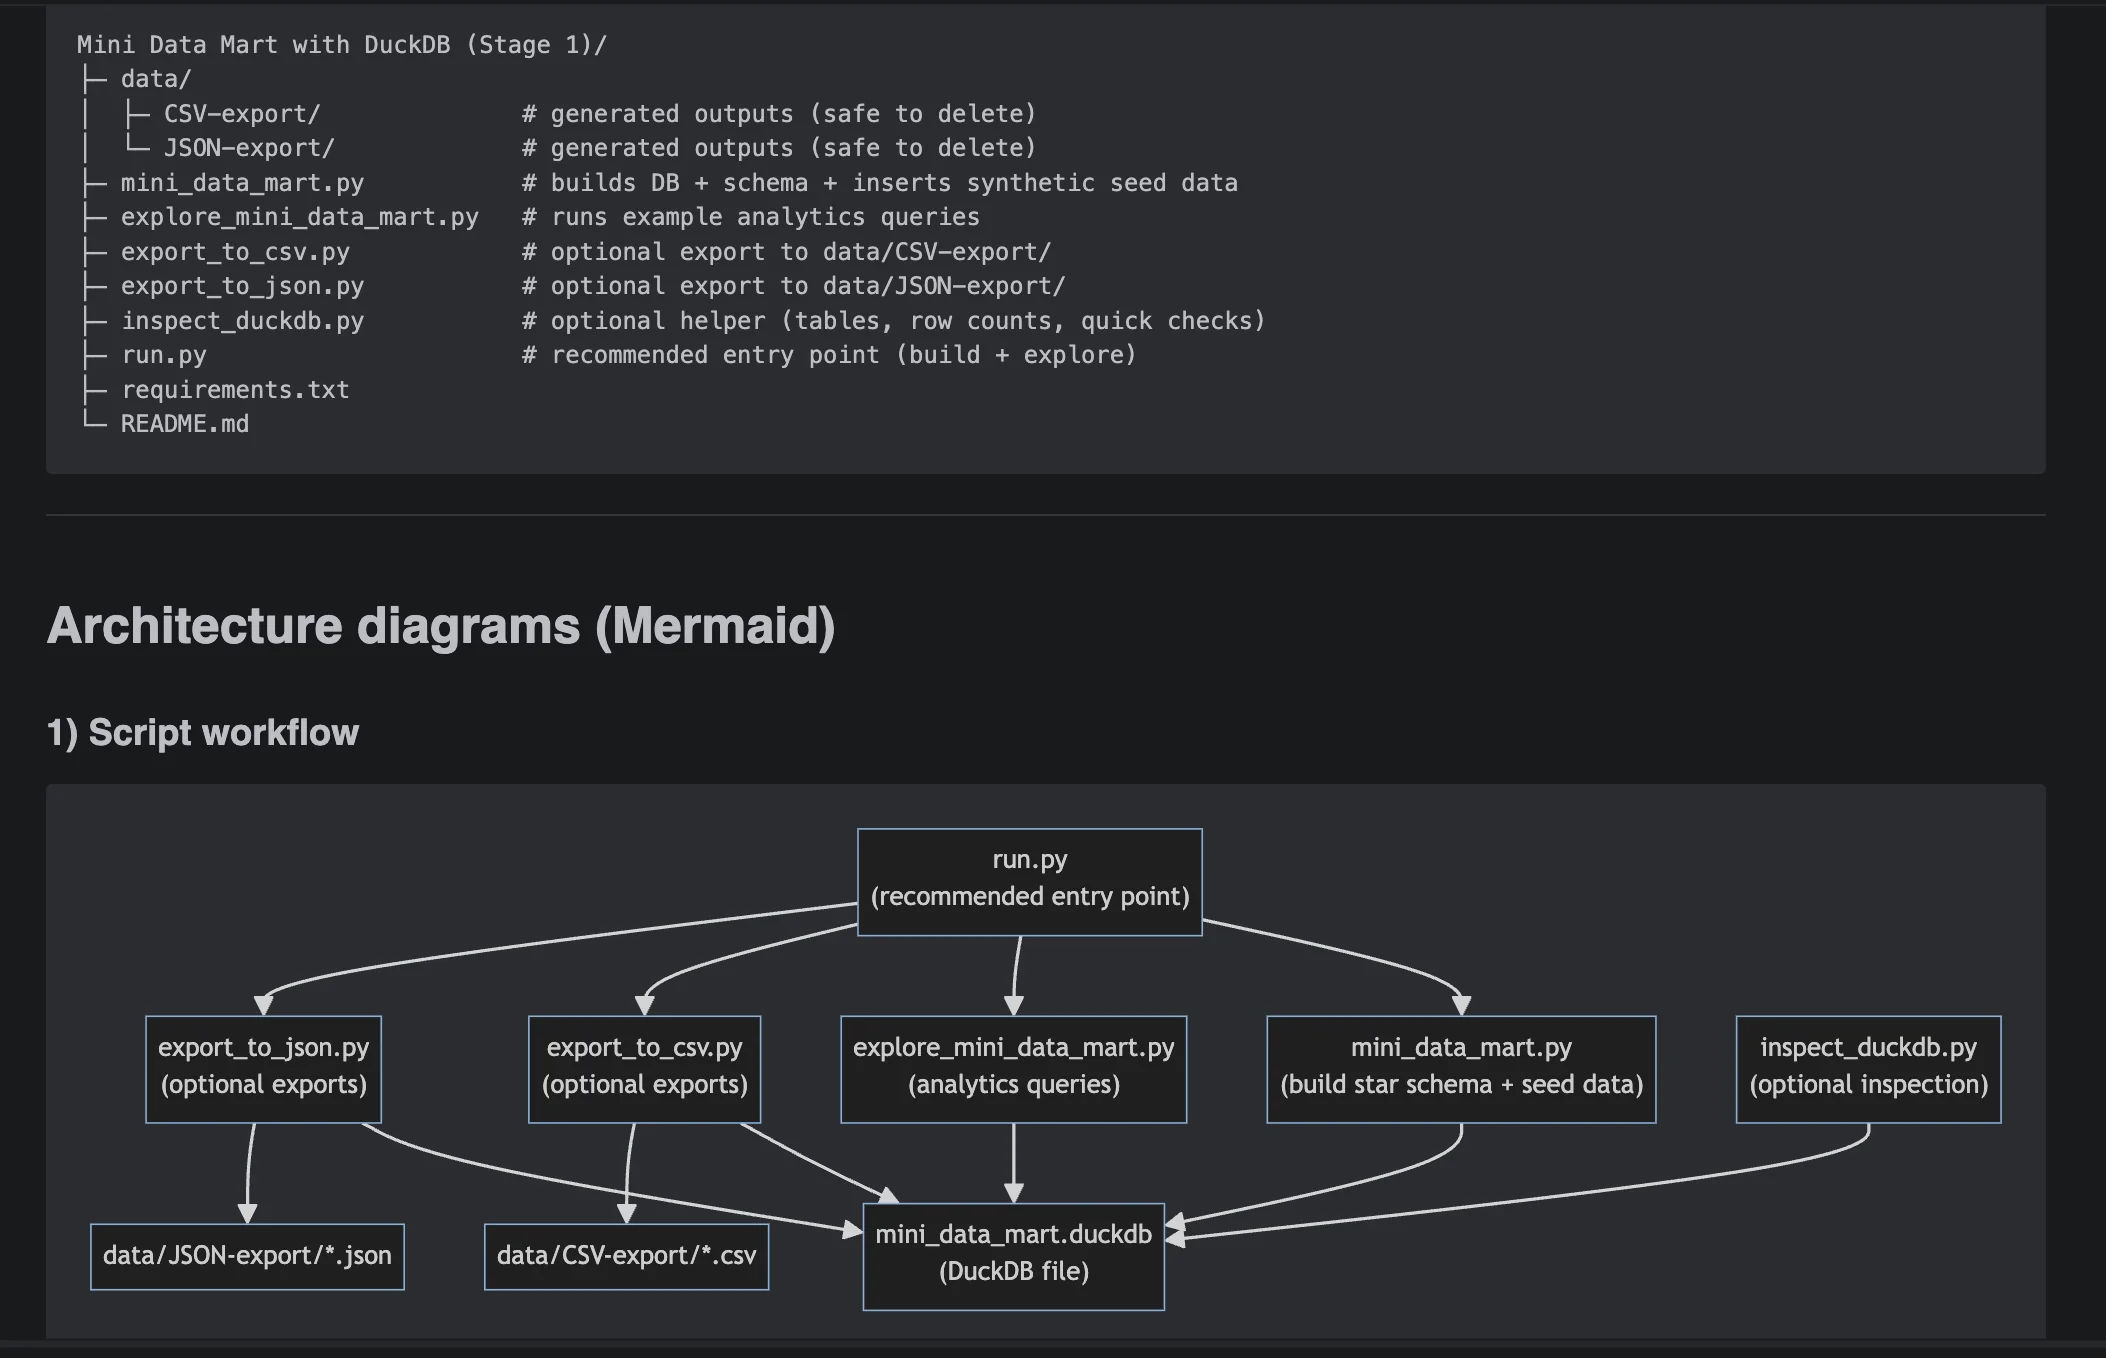
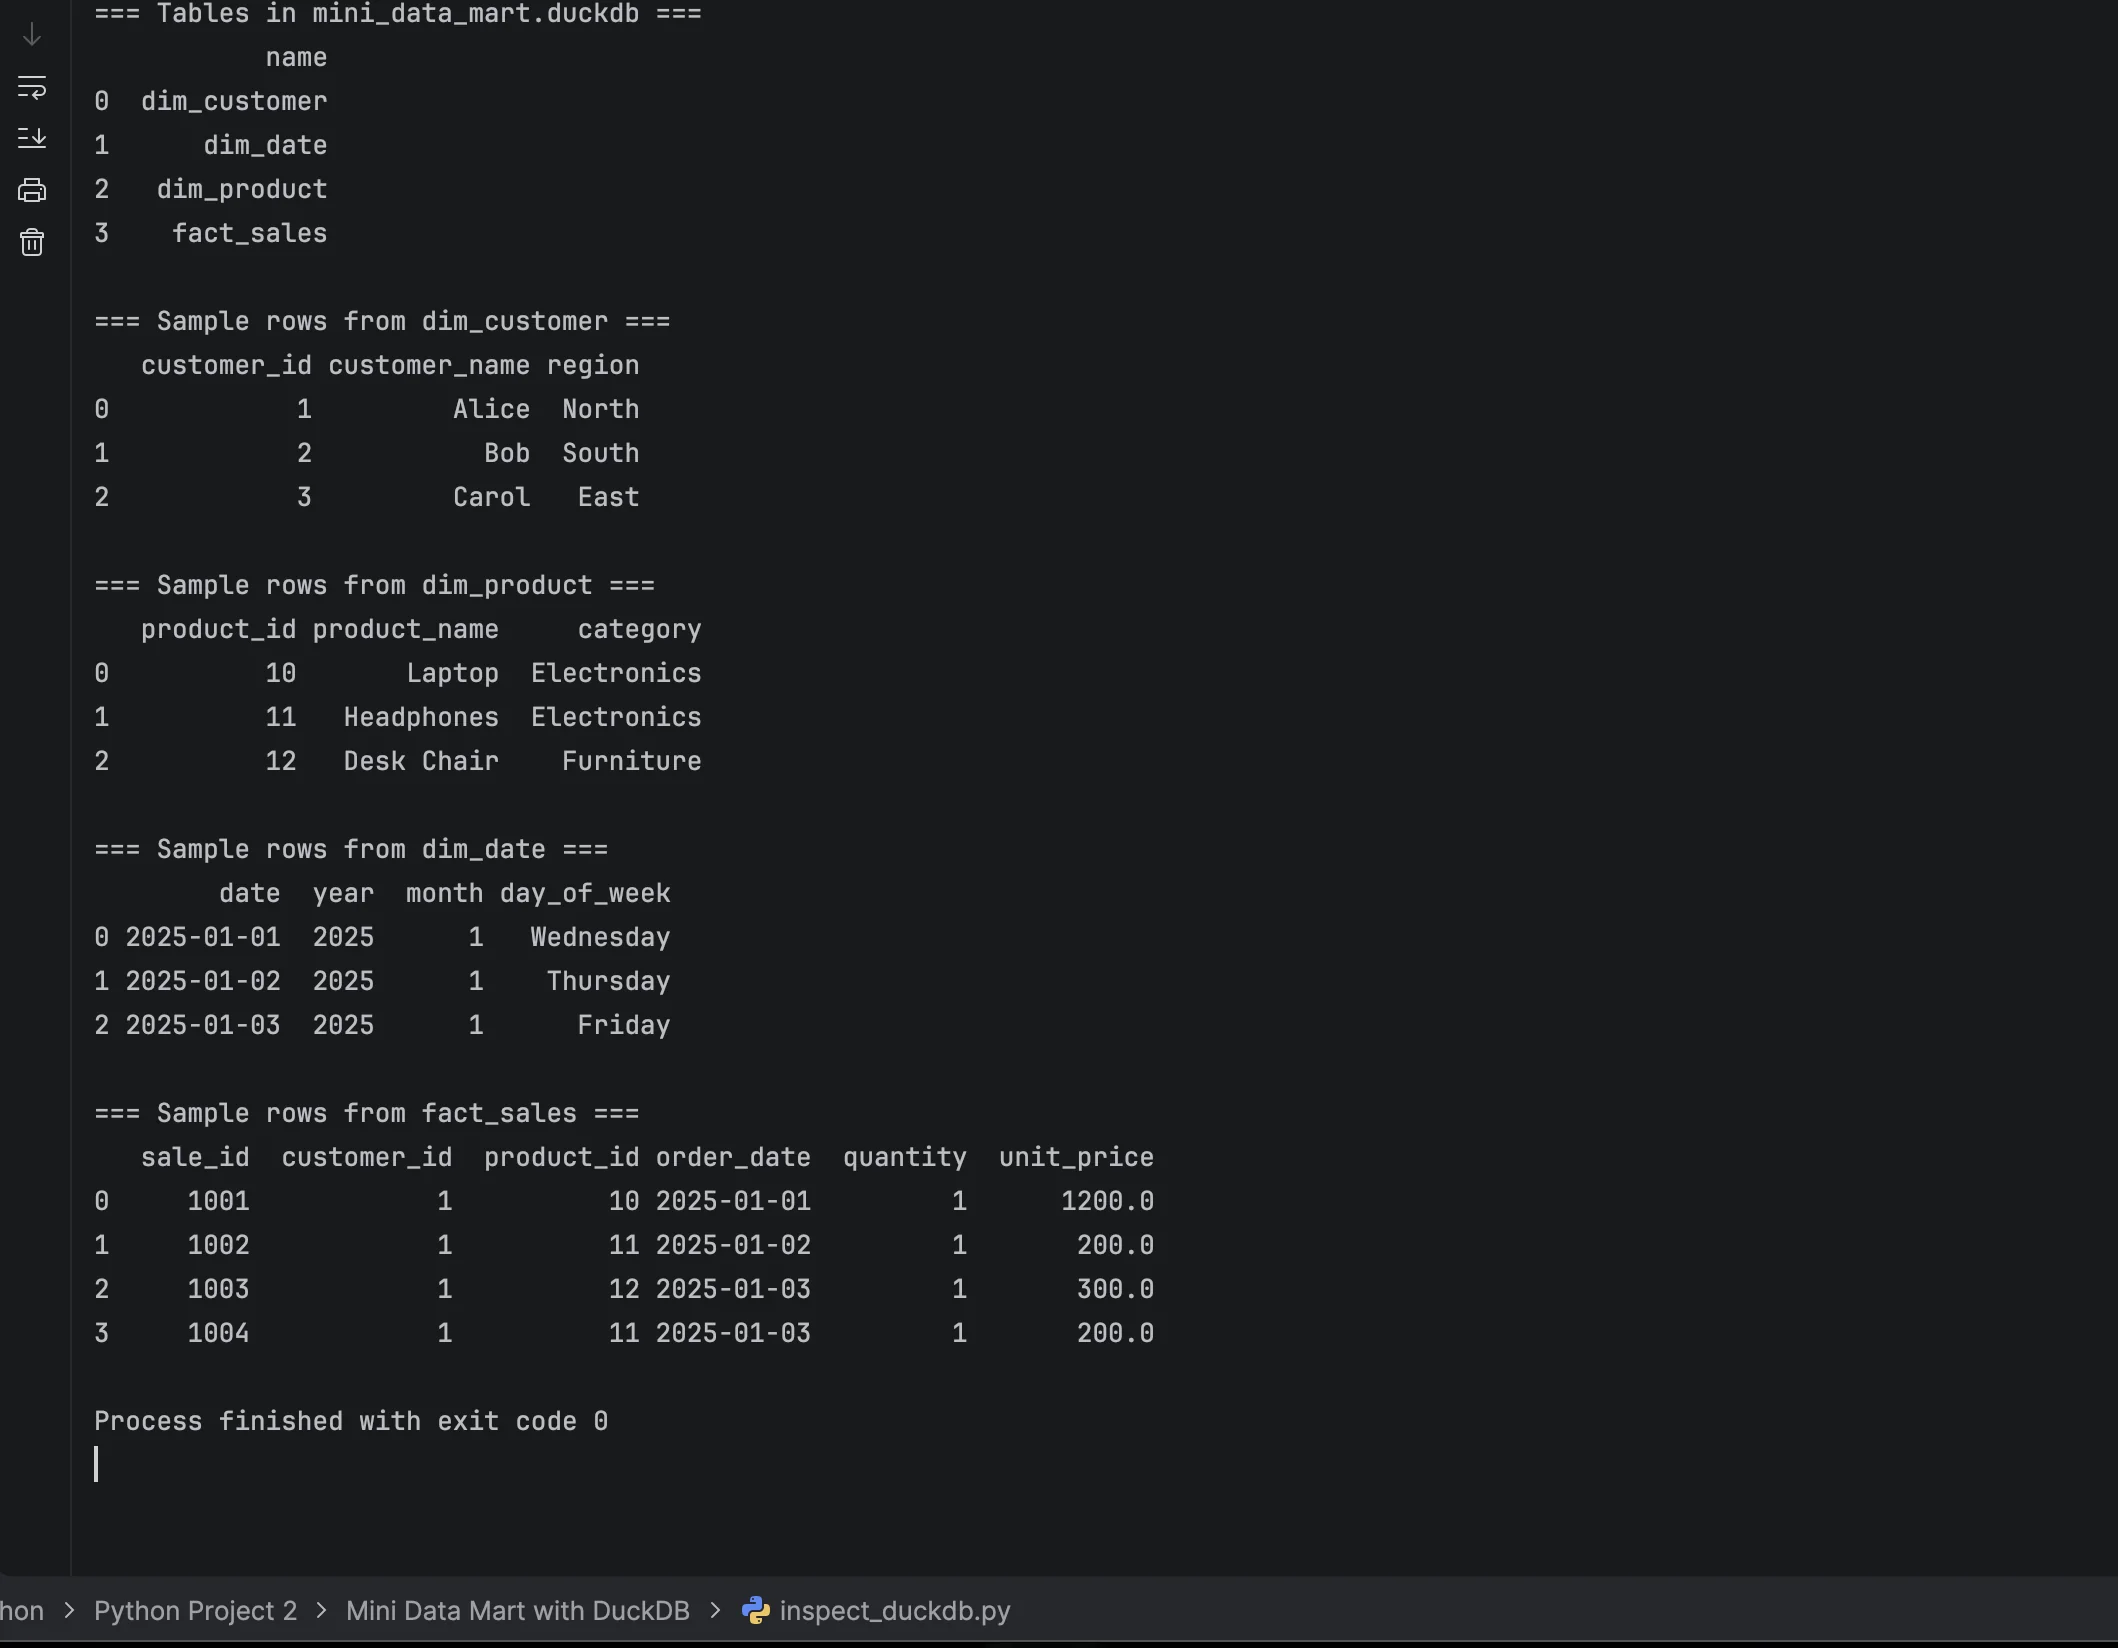
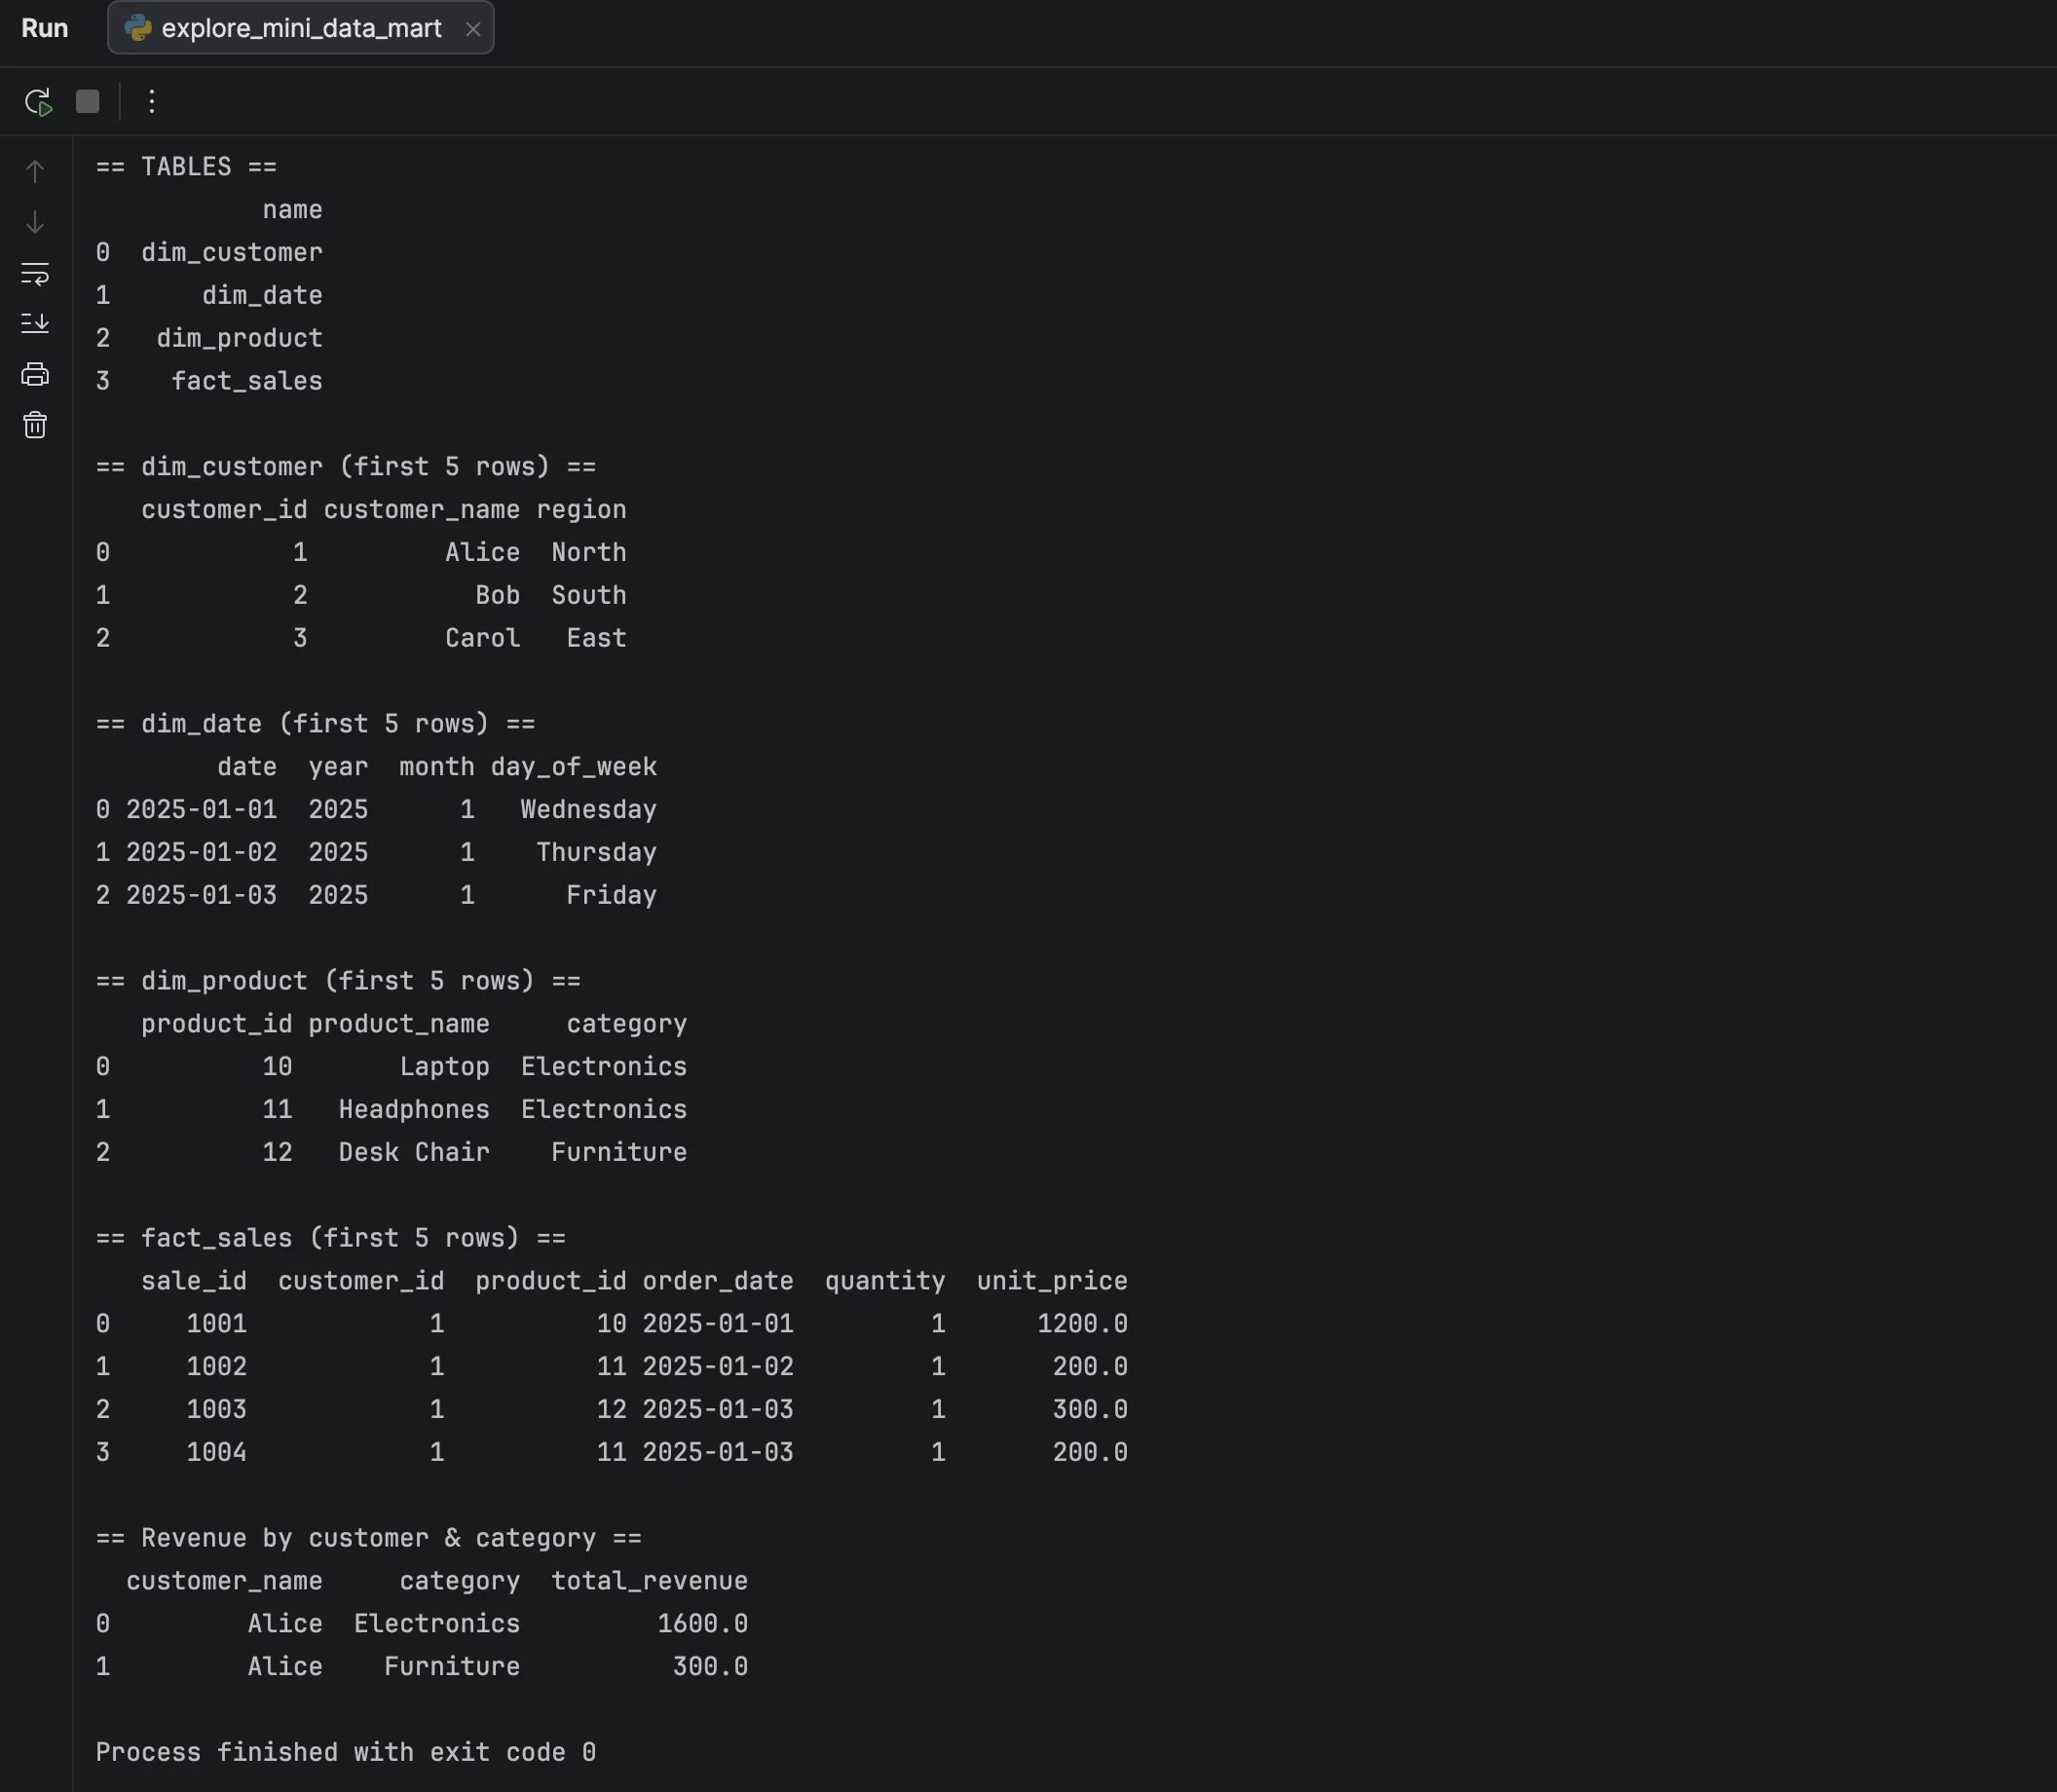
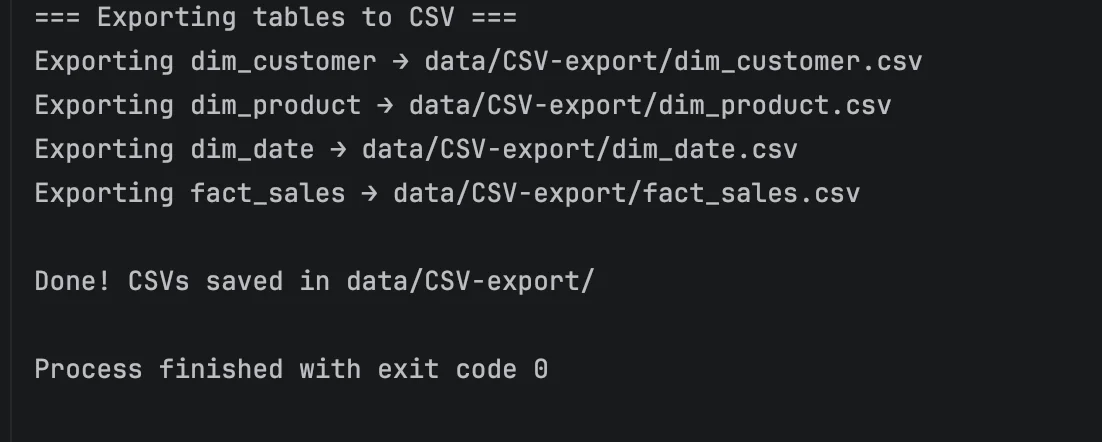
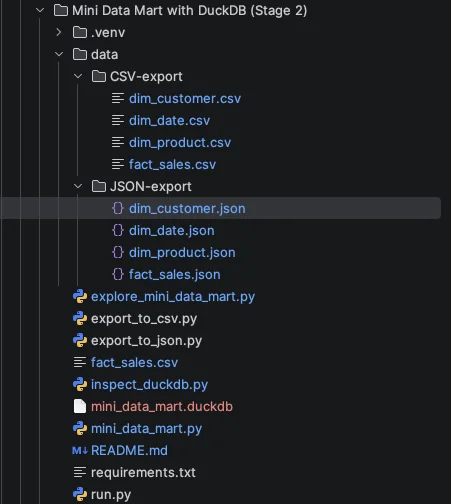
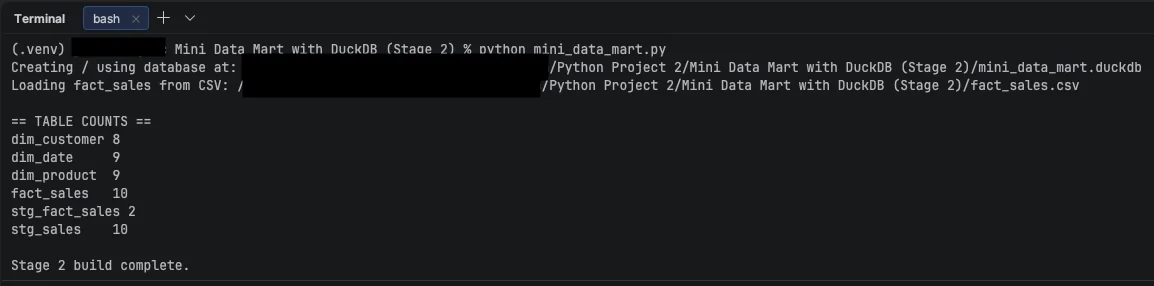
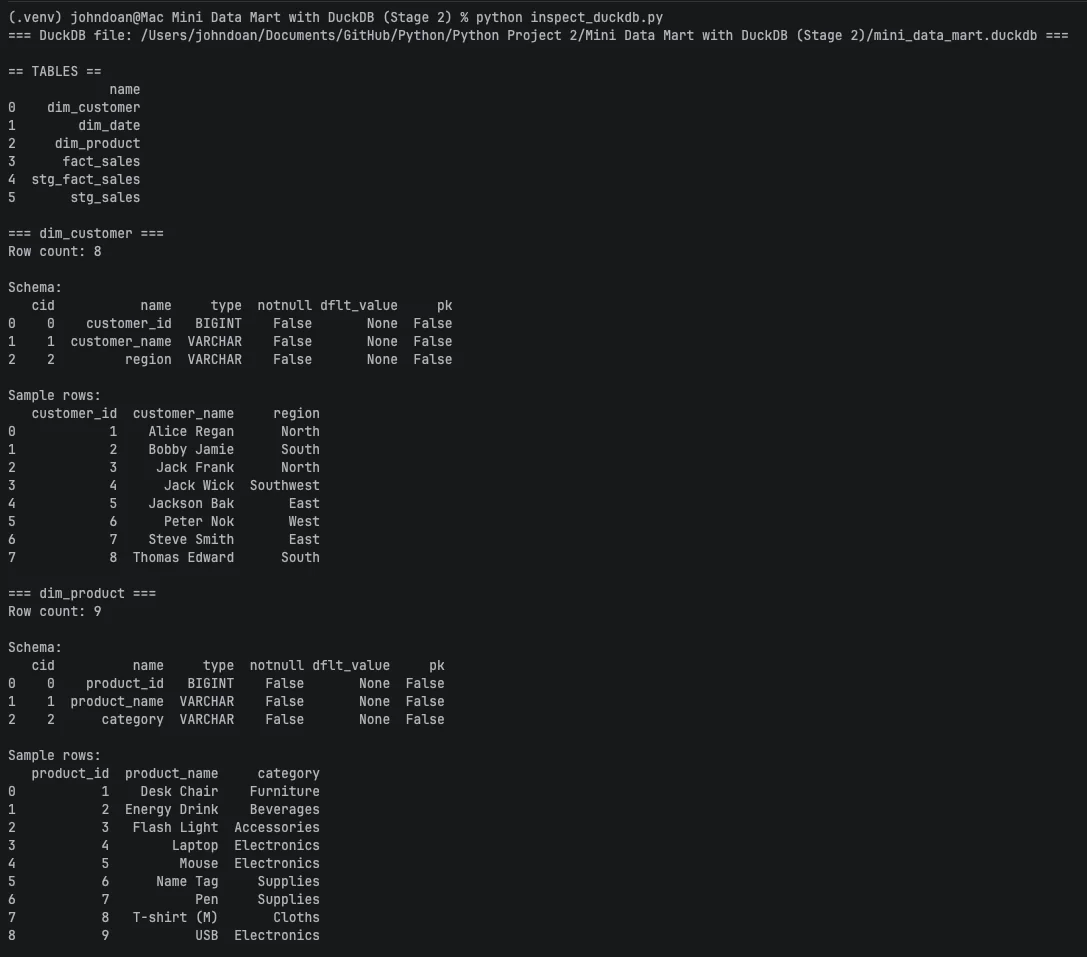
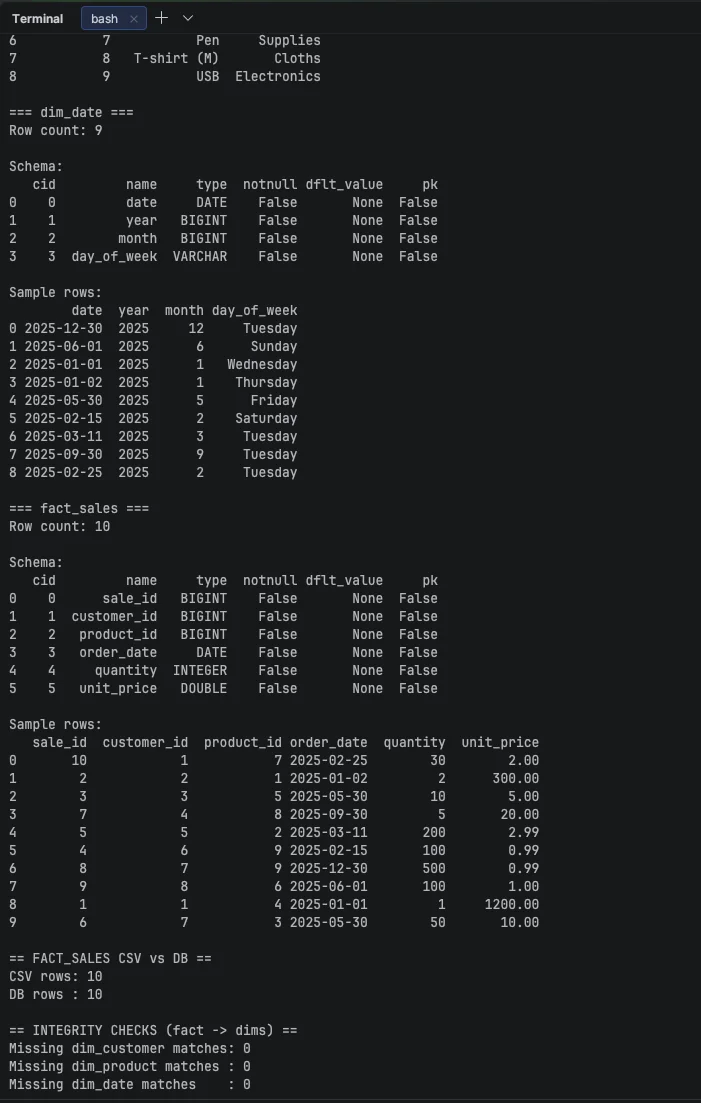
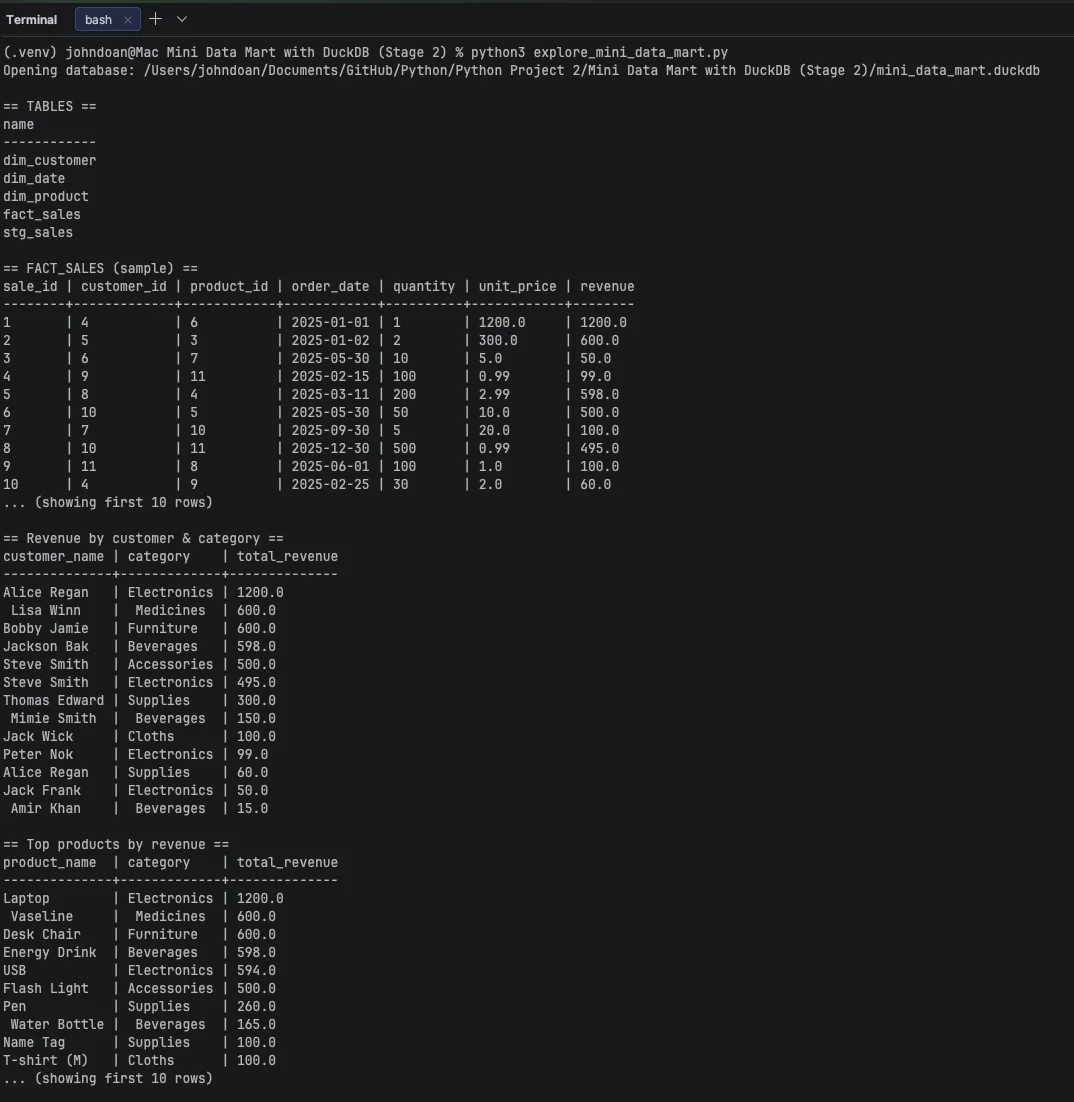
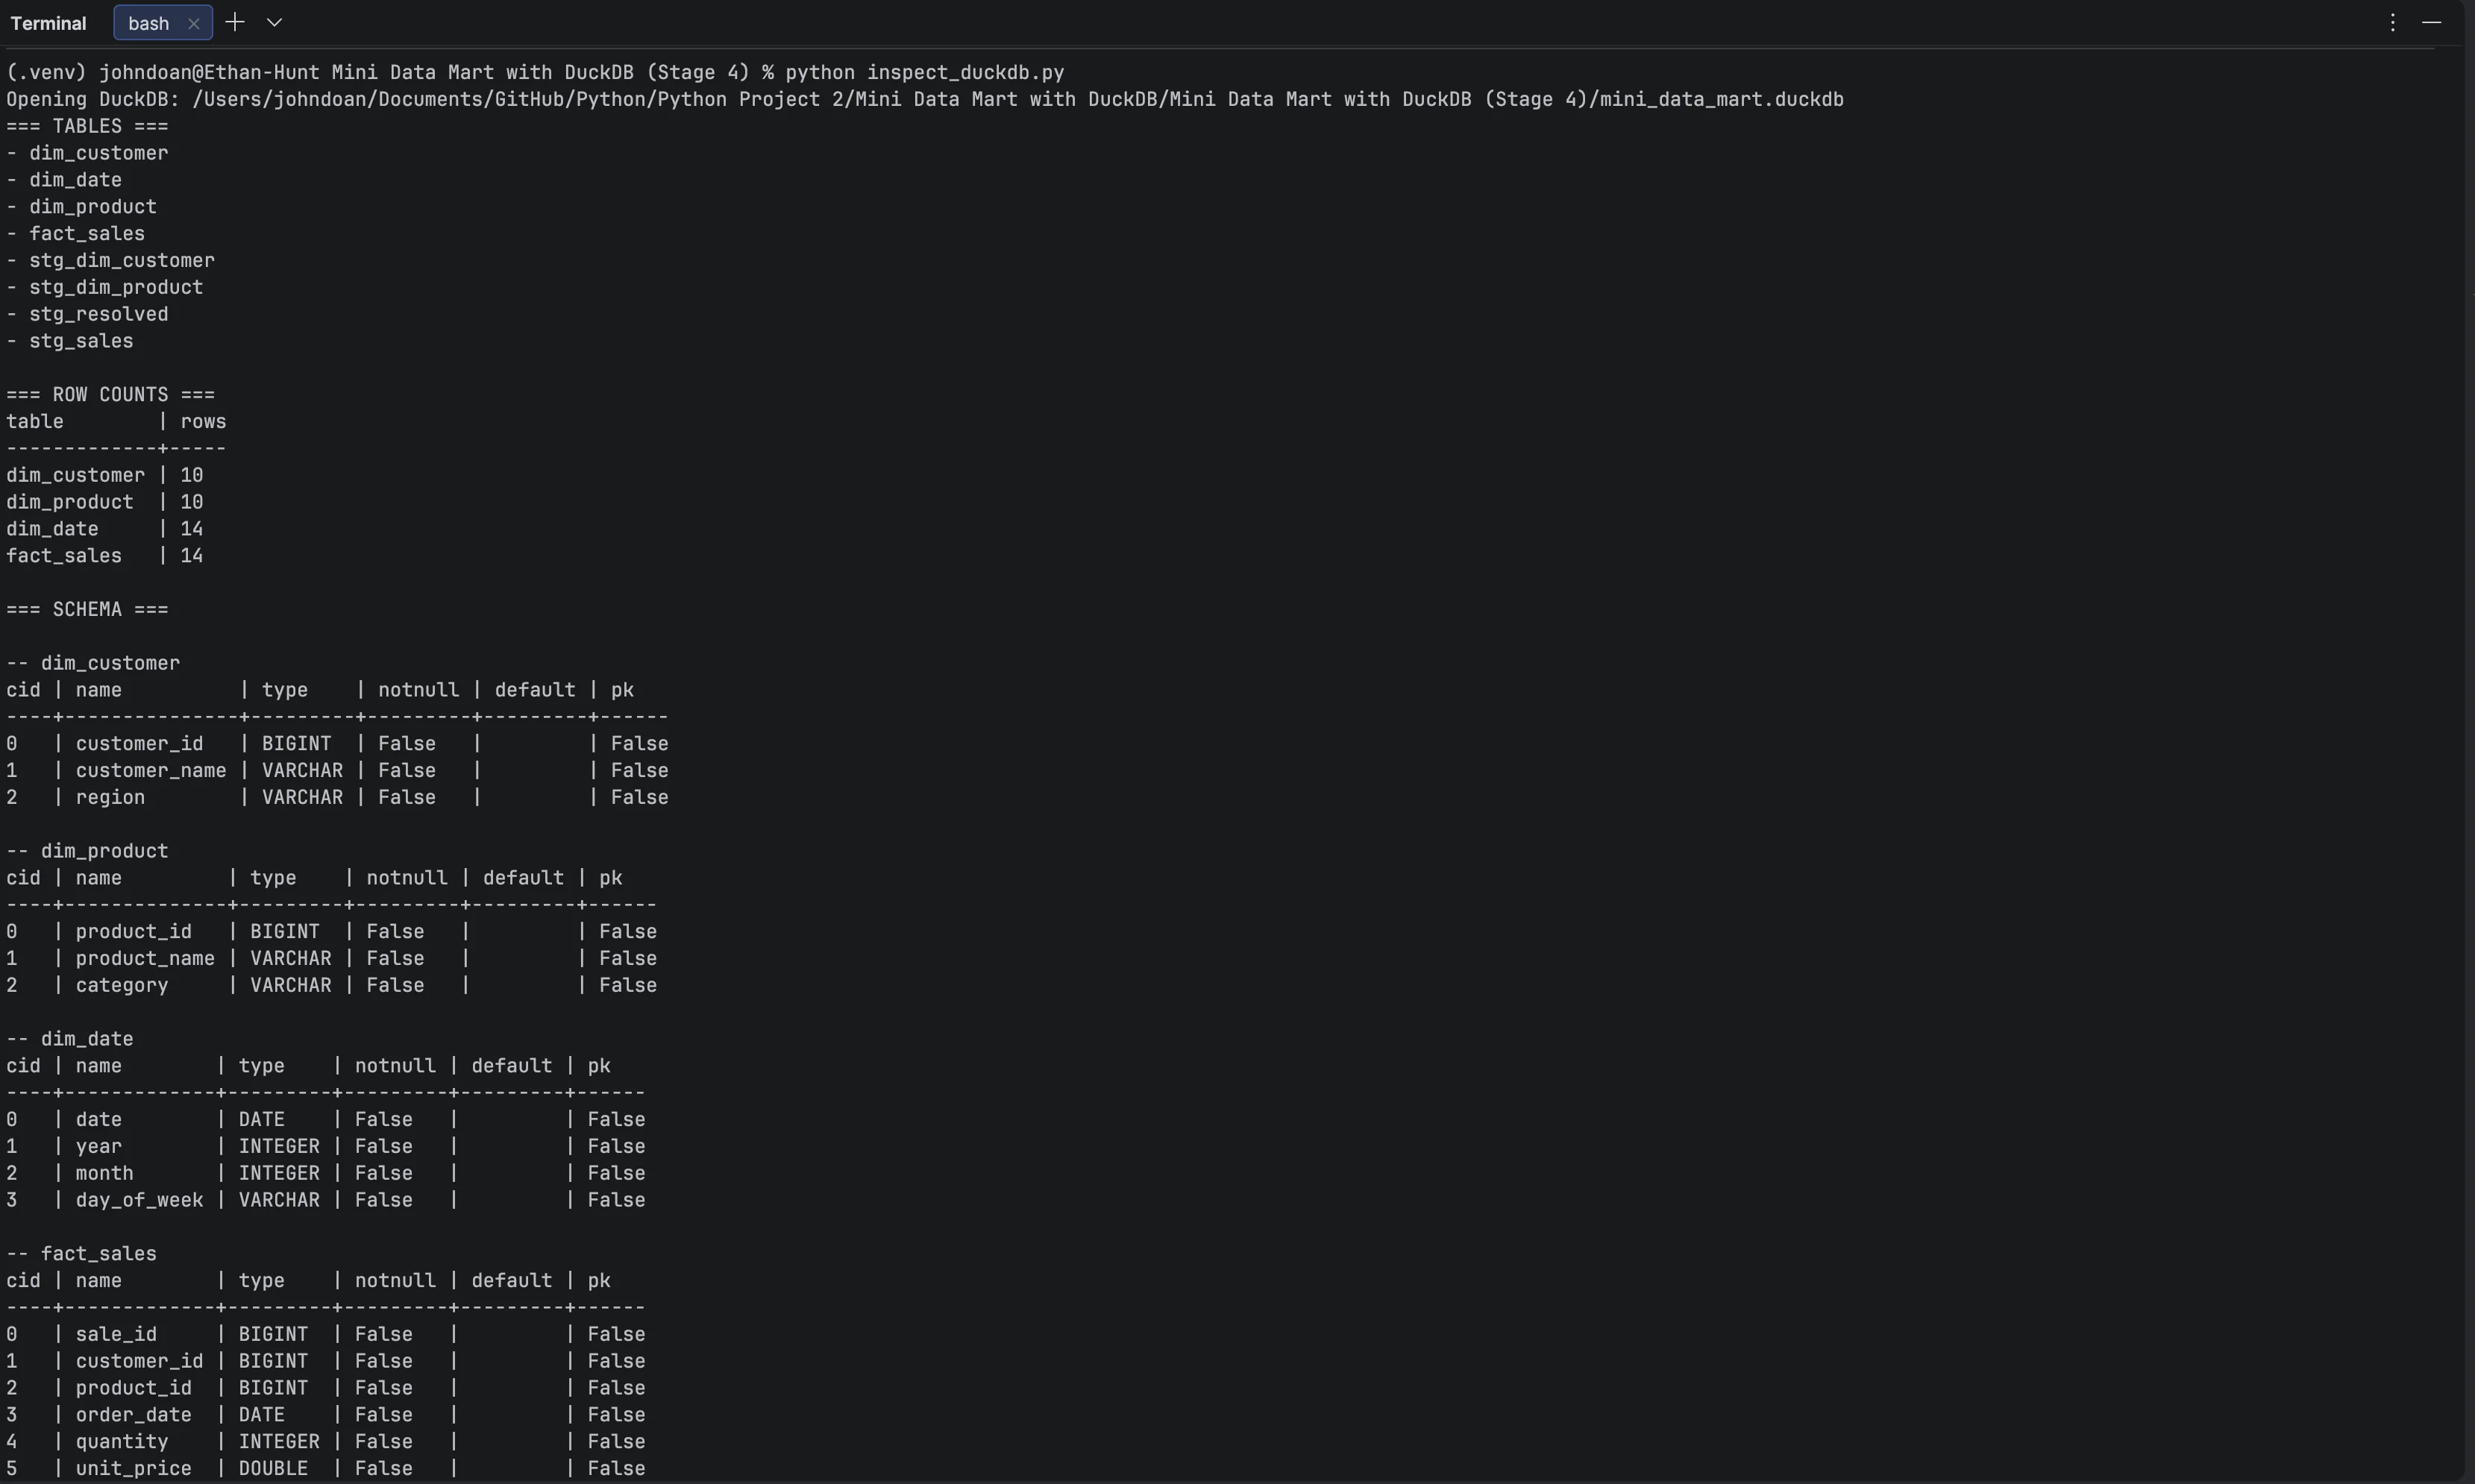
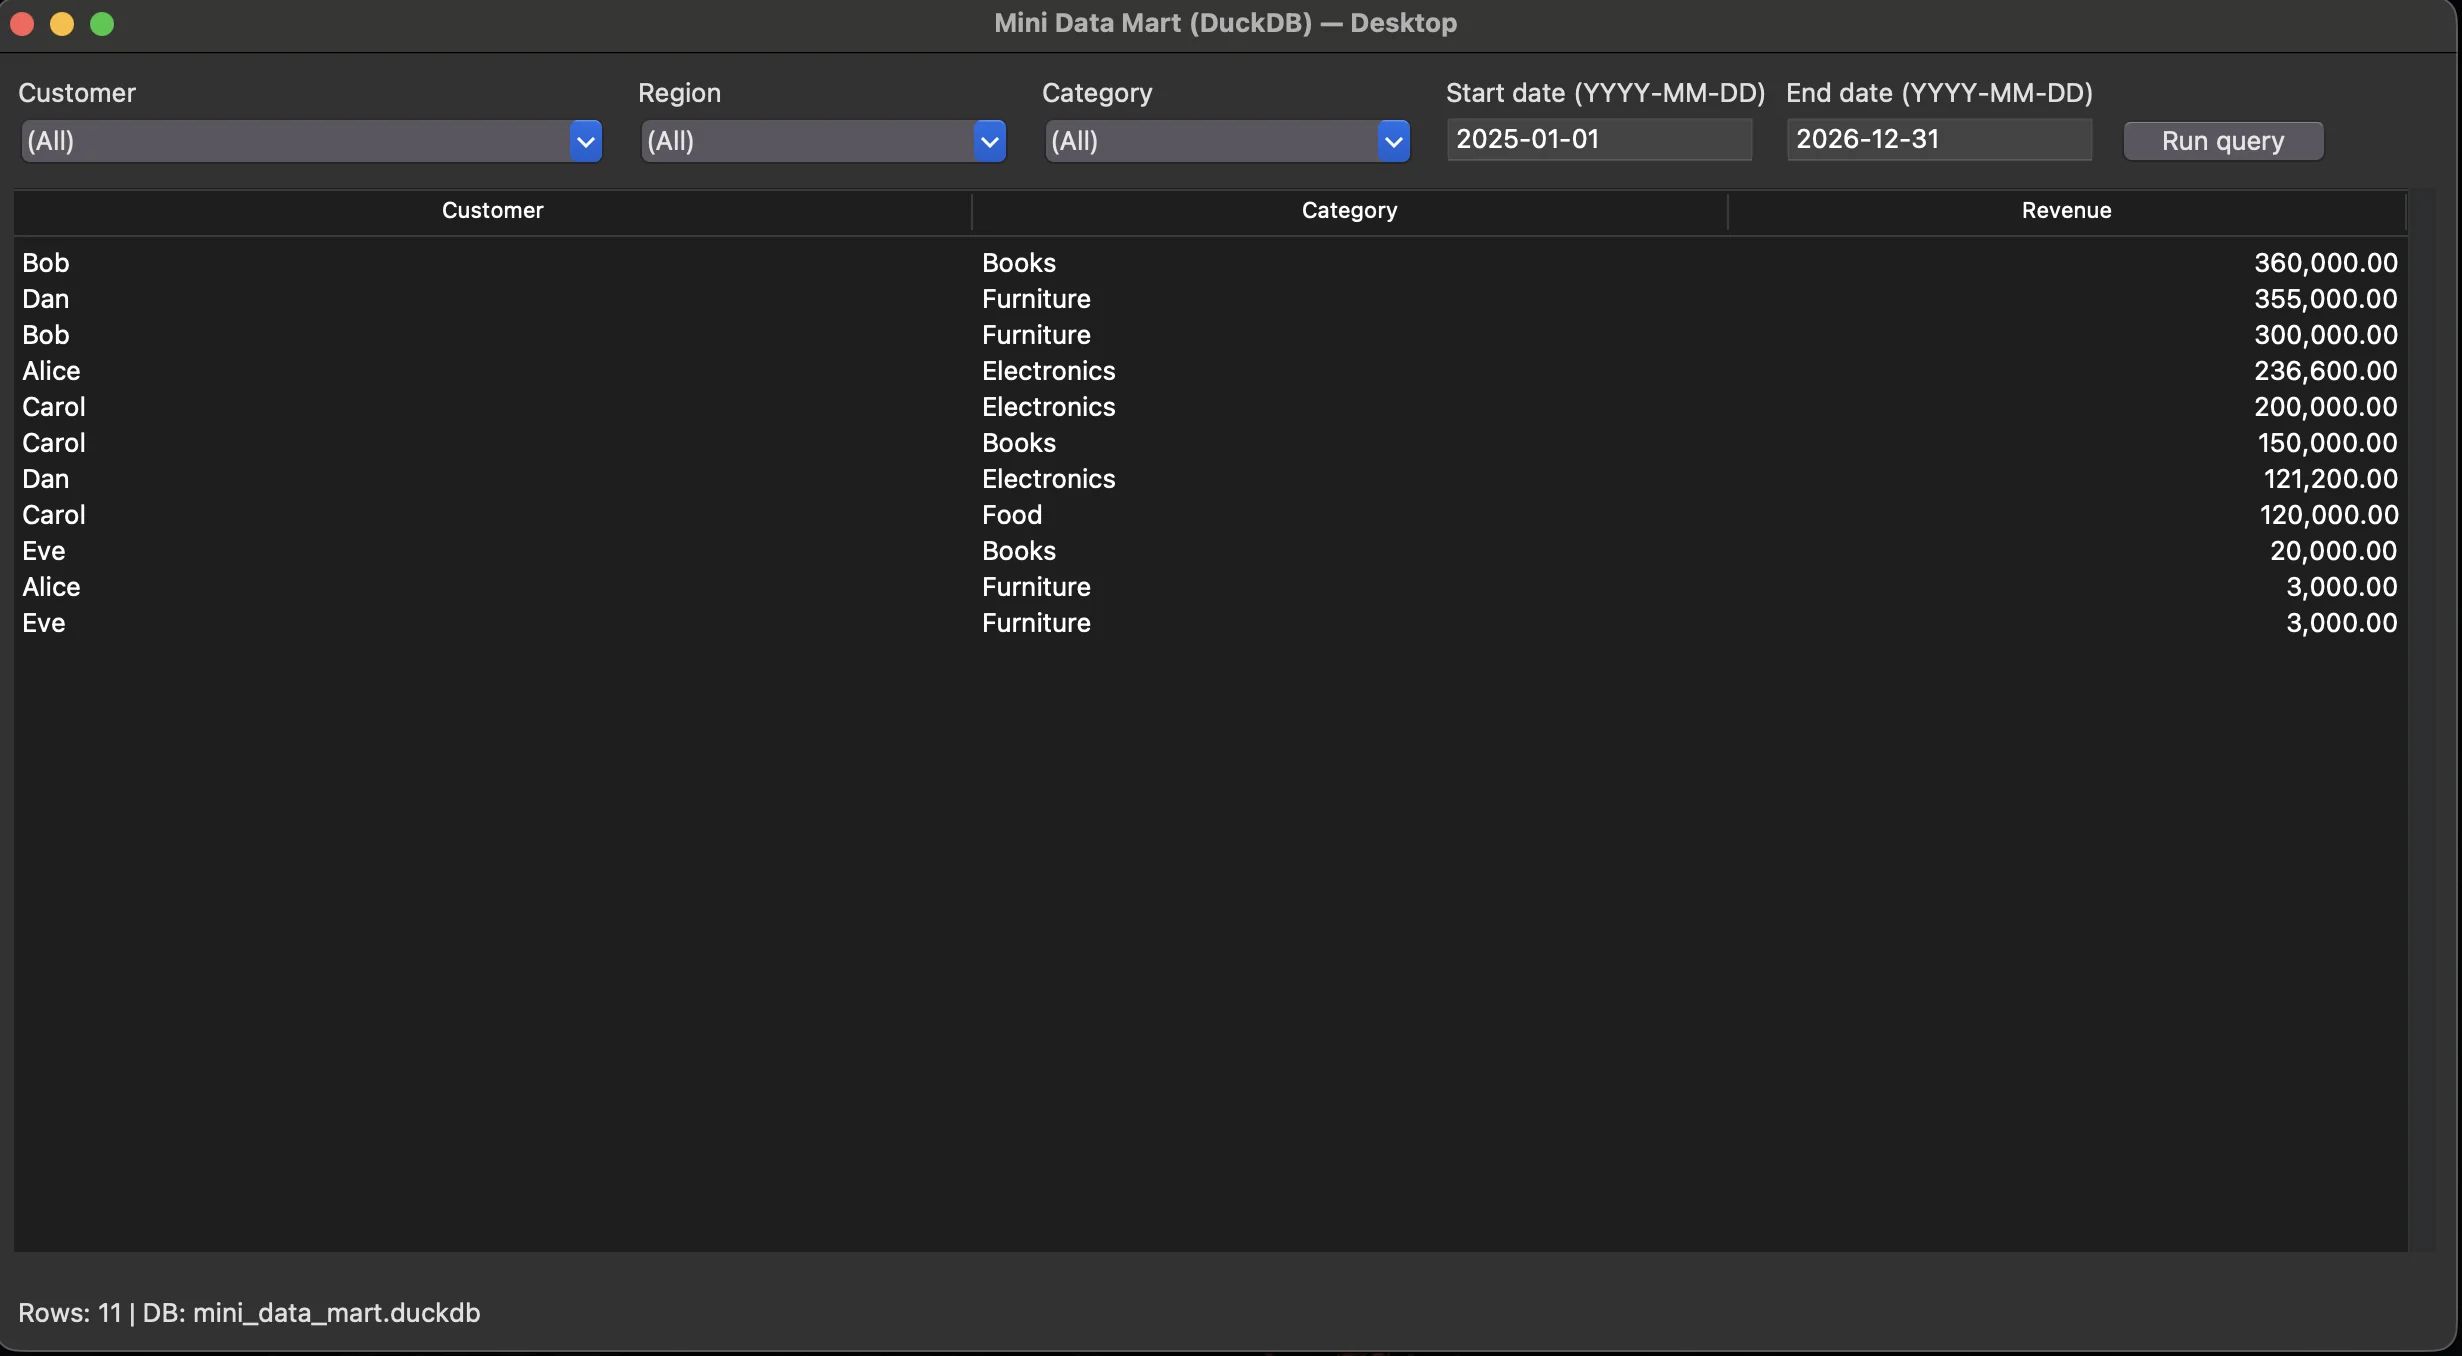
A staged DuckDB + Python mini data mart built around a star schema (dimensions + fact table), with analytics queries and export utilities.
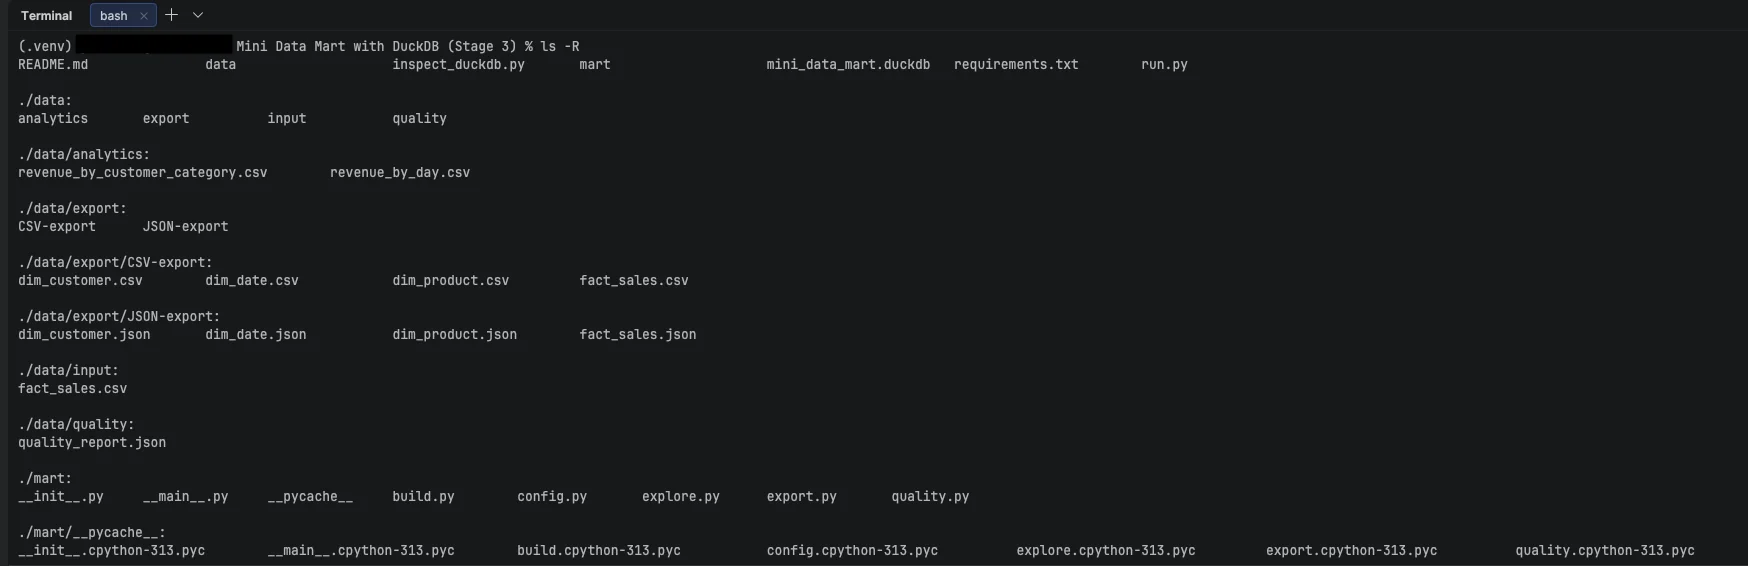
- Stage 1: Build the mart with hardcoded seed data (clean, repeatable setup).
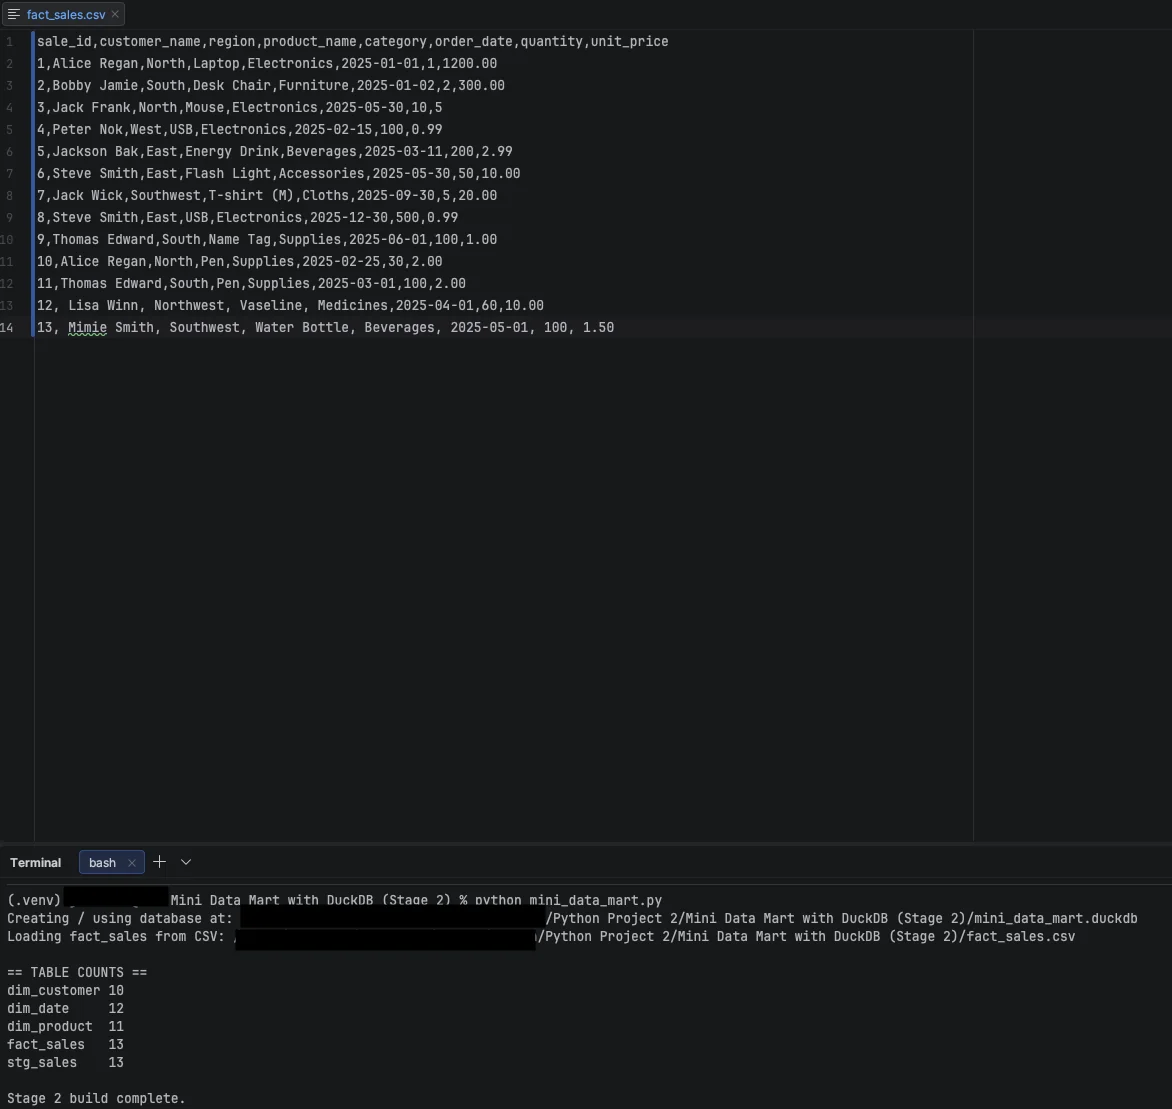
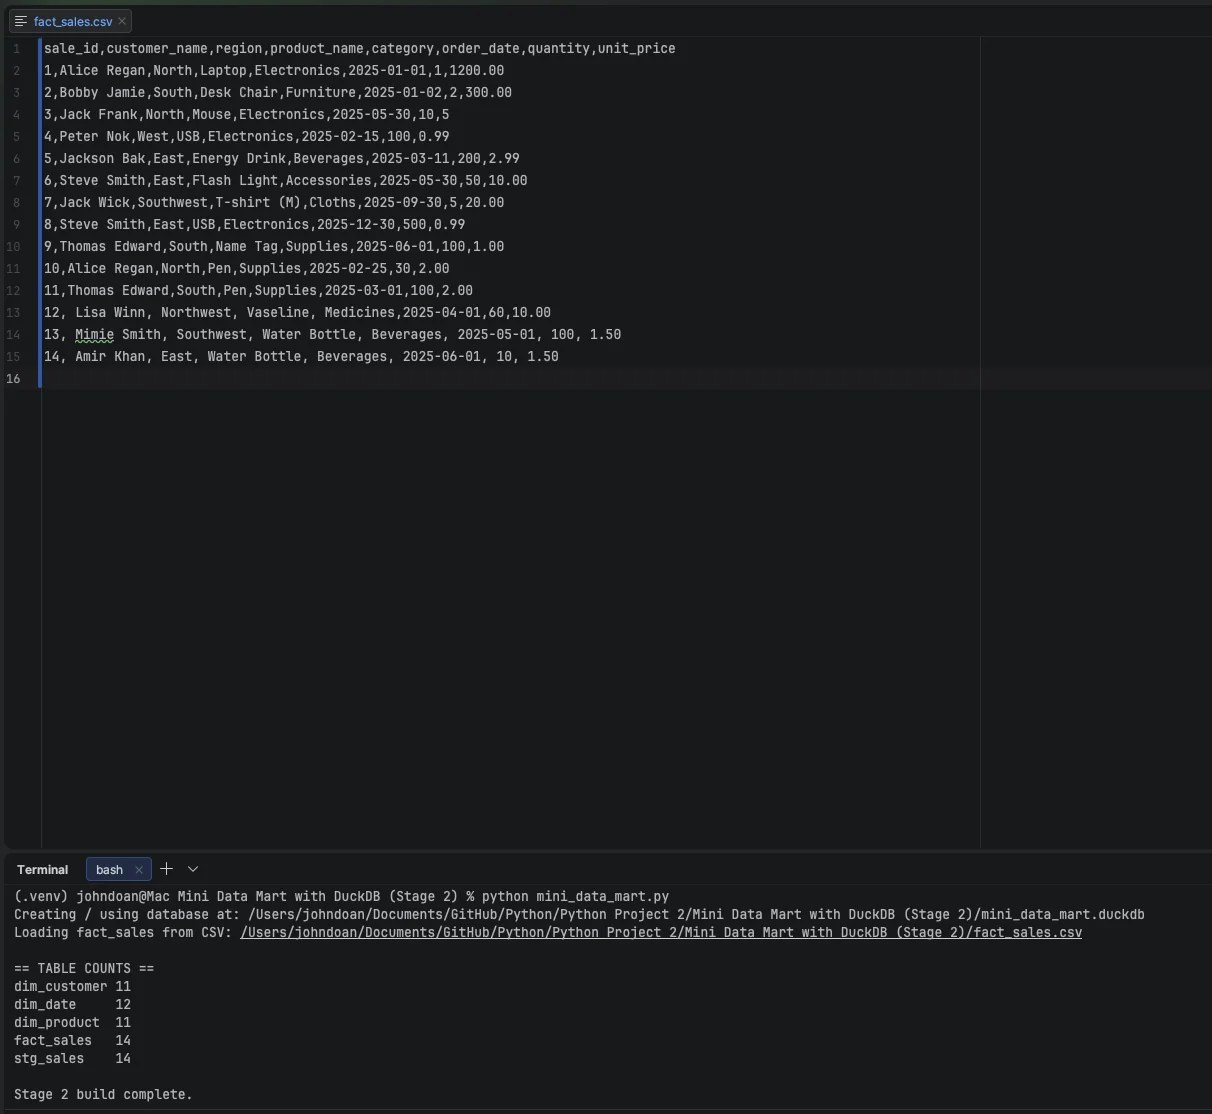
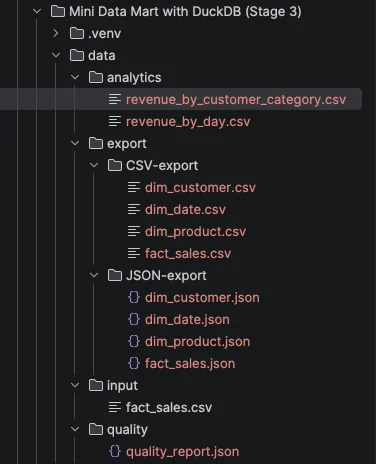
- Stage 2: Load facts (and optionally dimensions) from CSV so new data updates the mart.
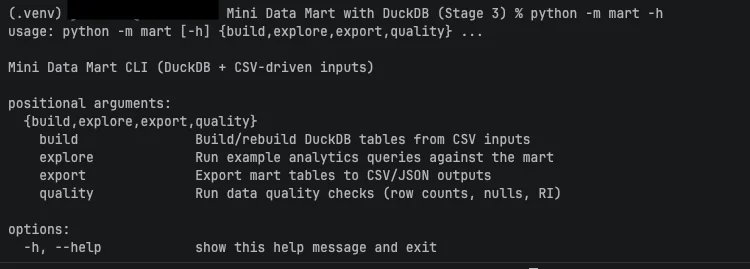
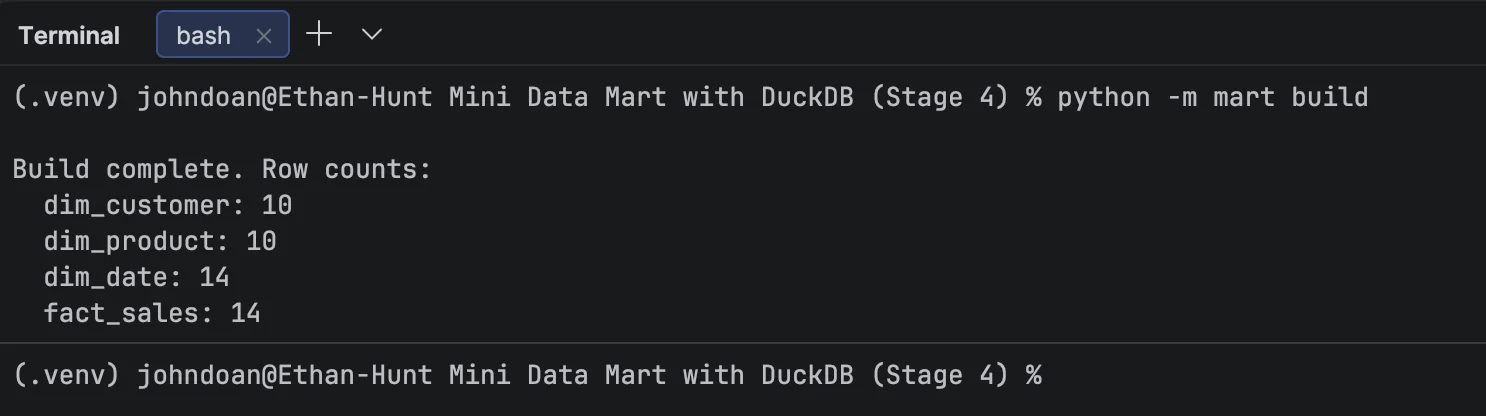
- Stage 3: Refactor into a Python package with a CLI (
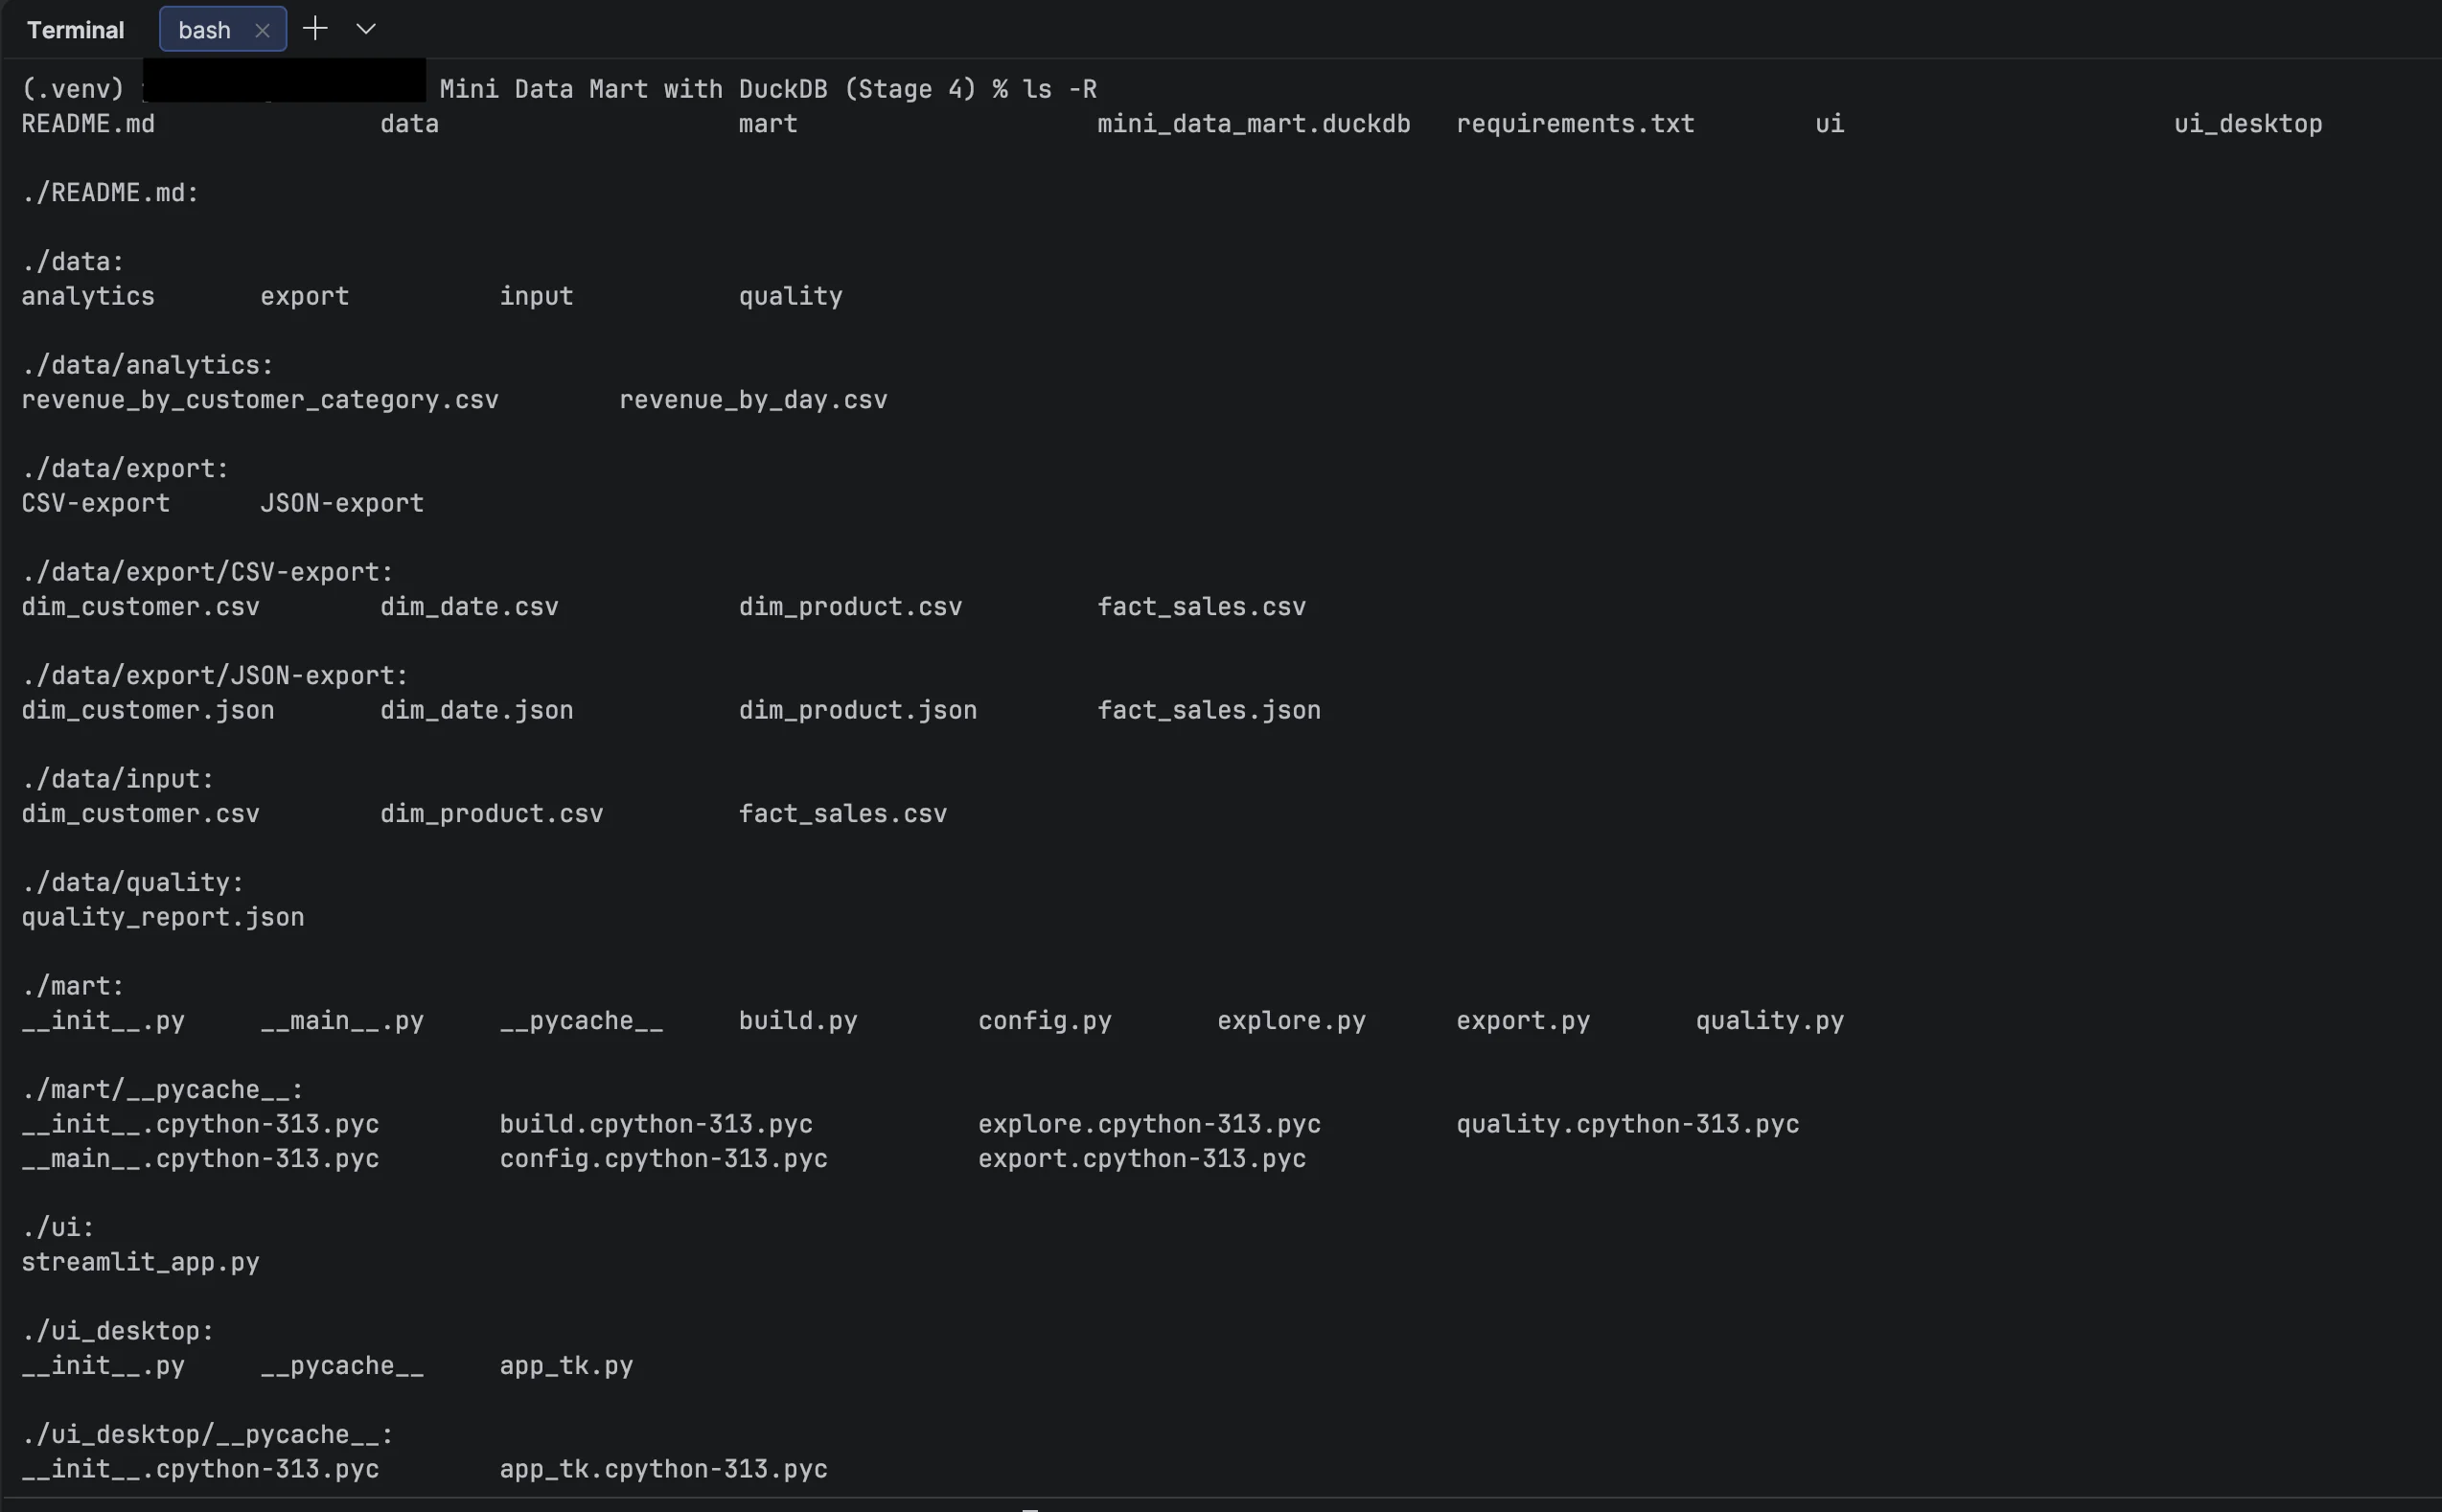
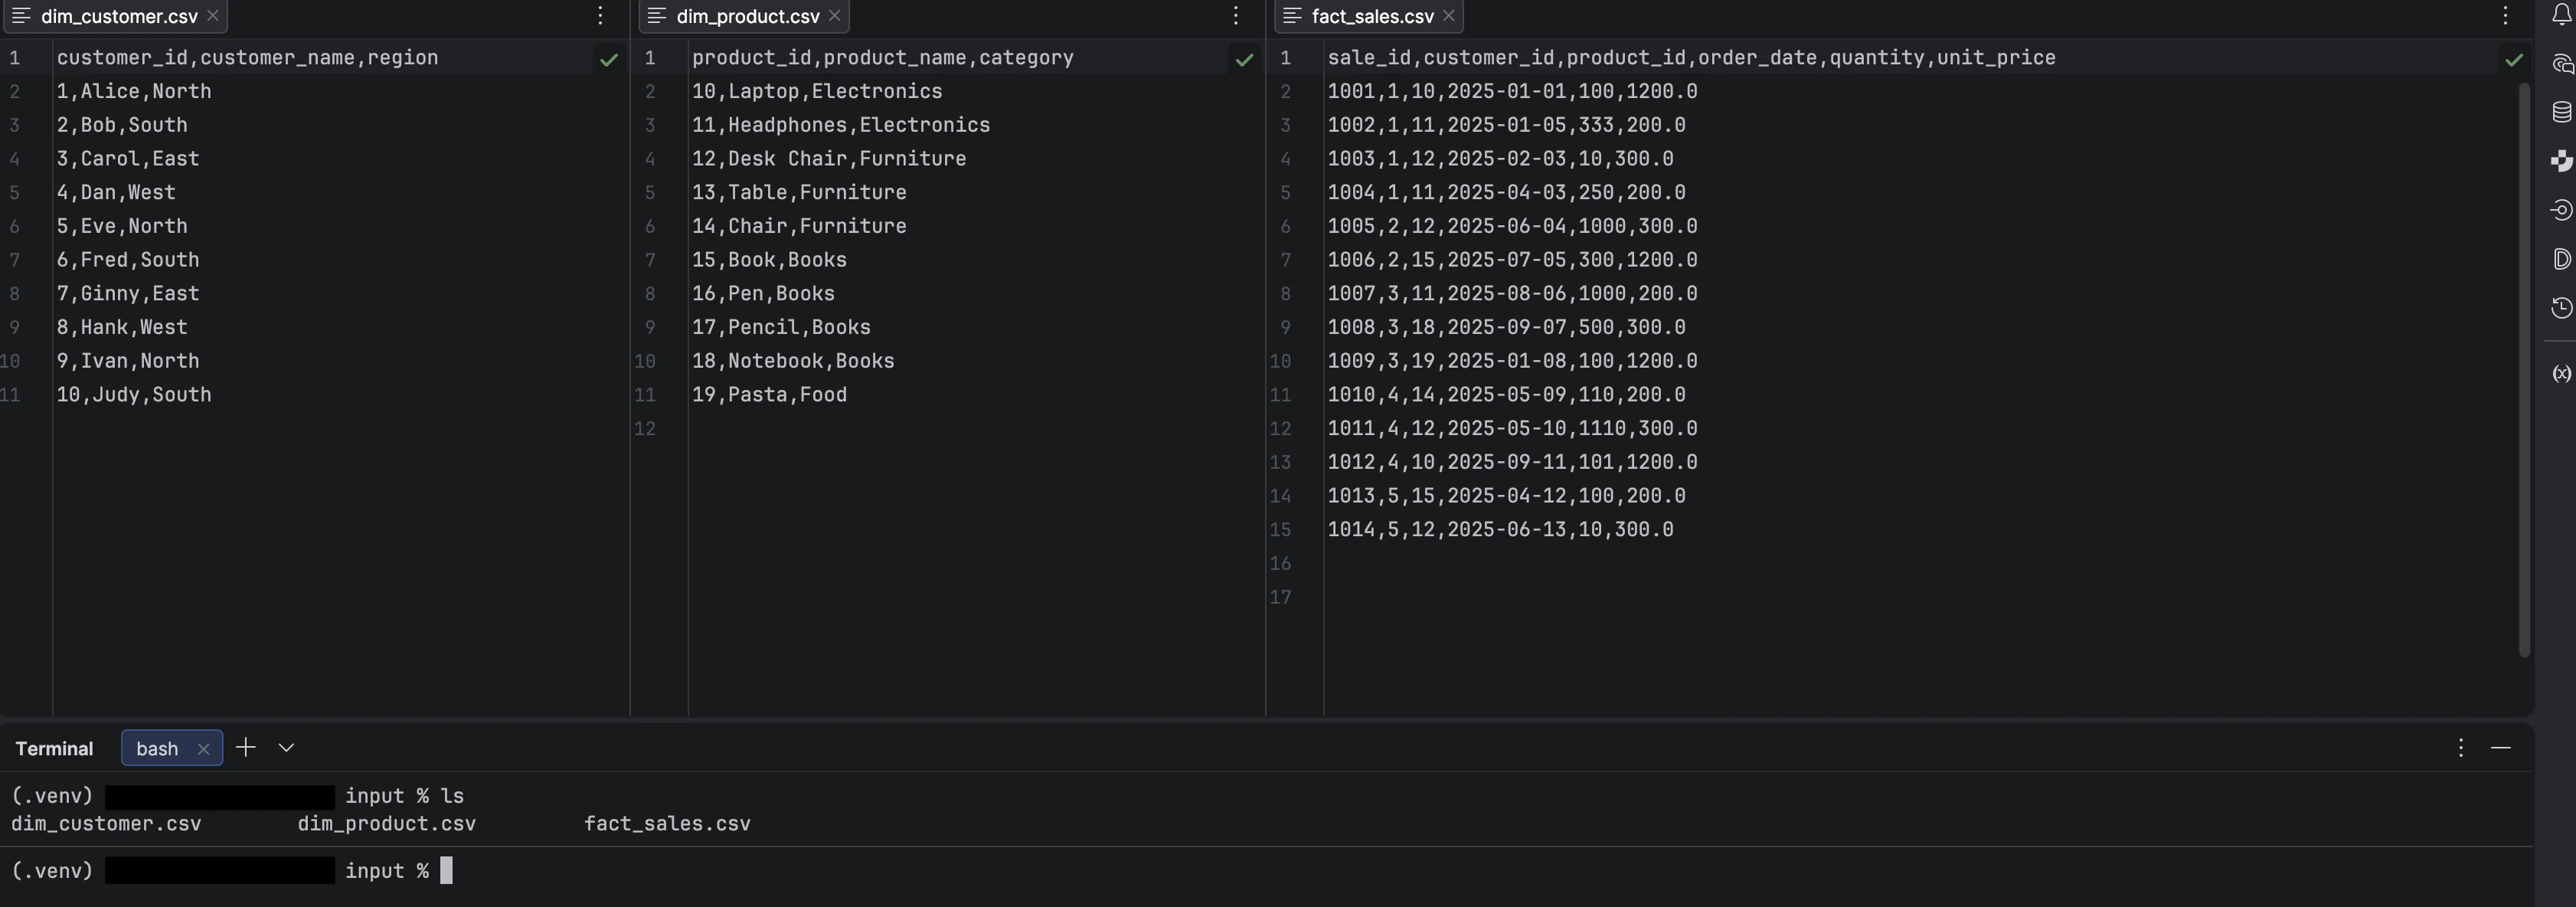
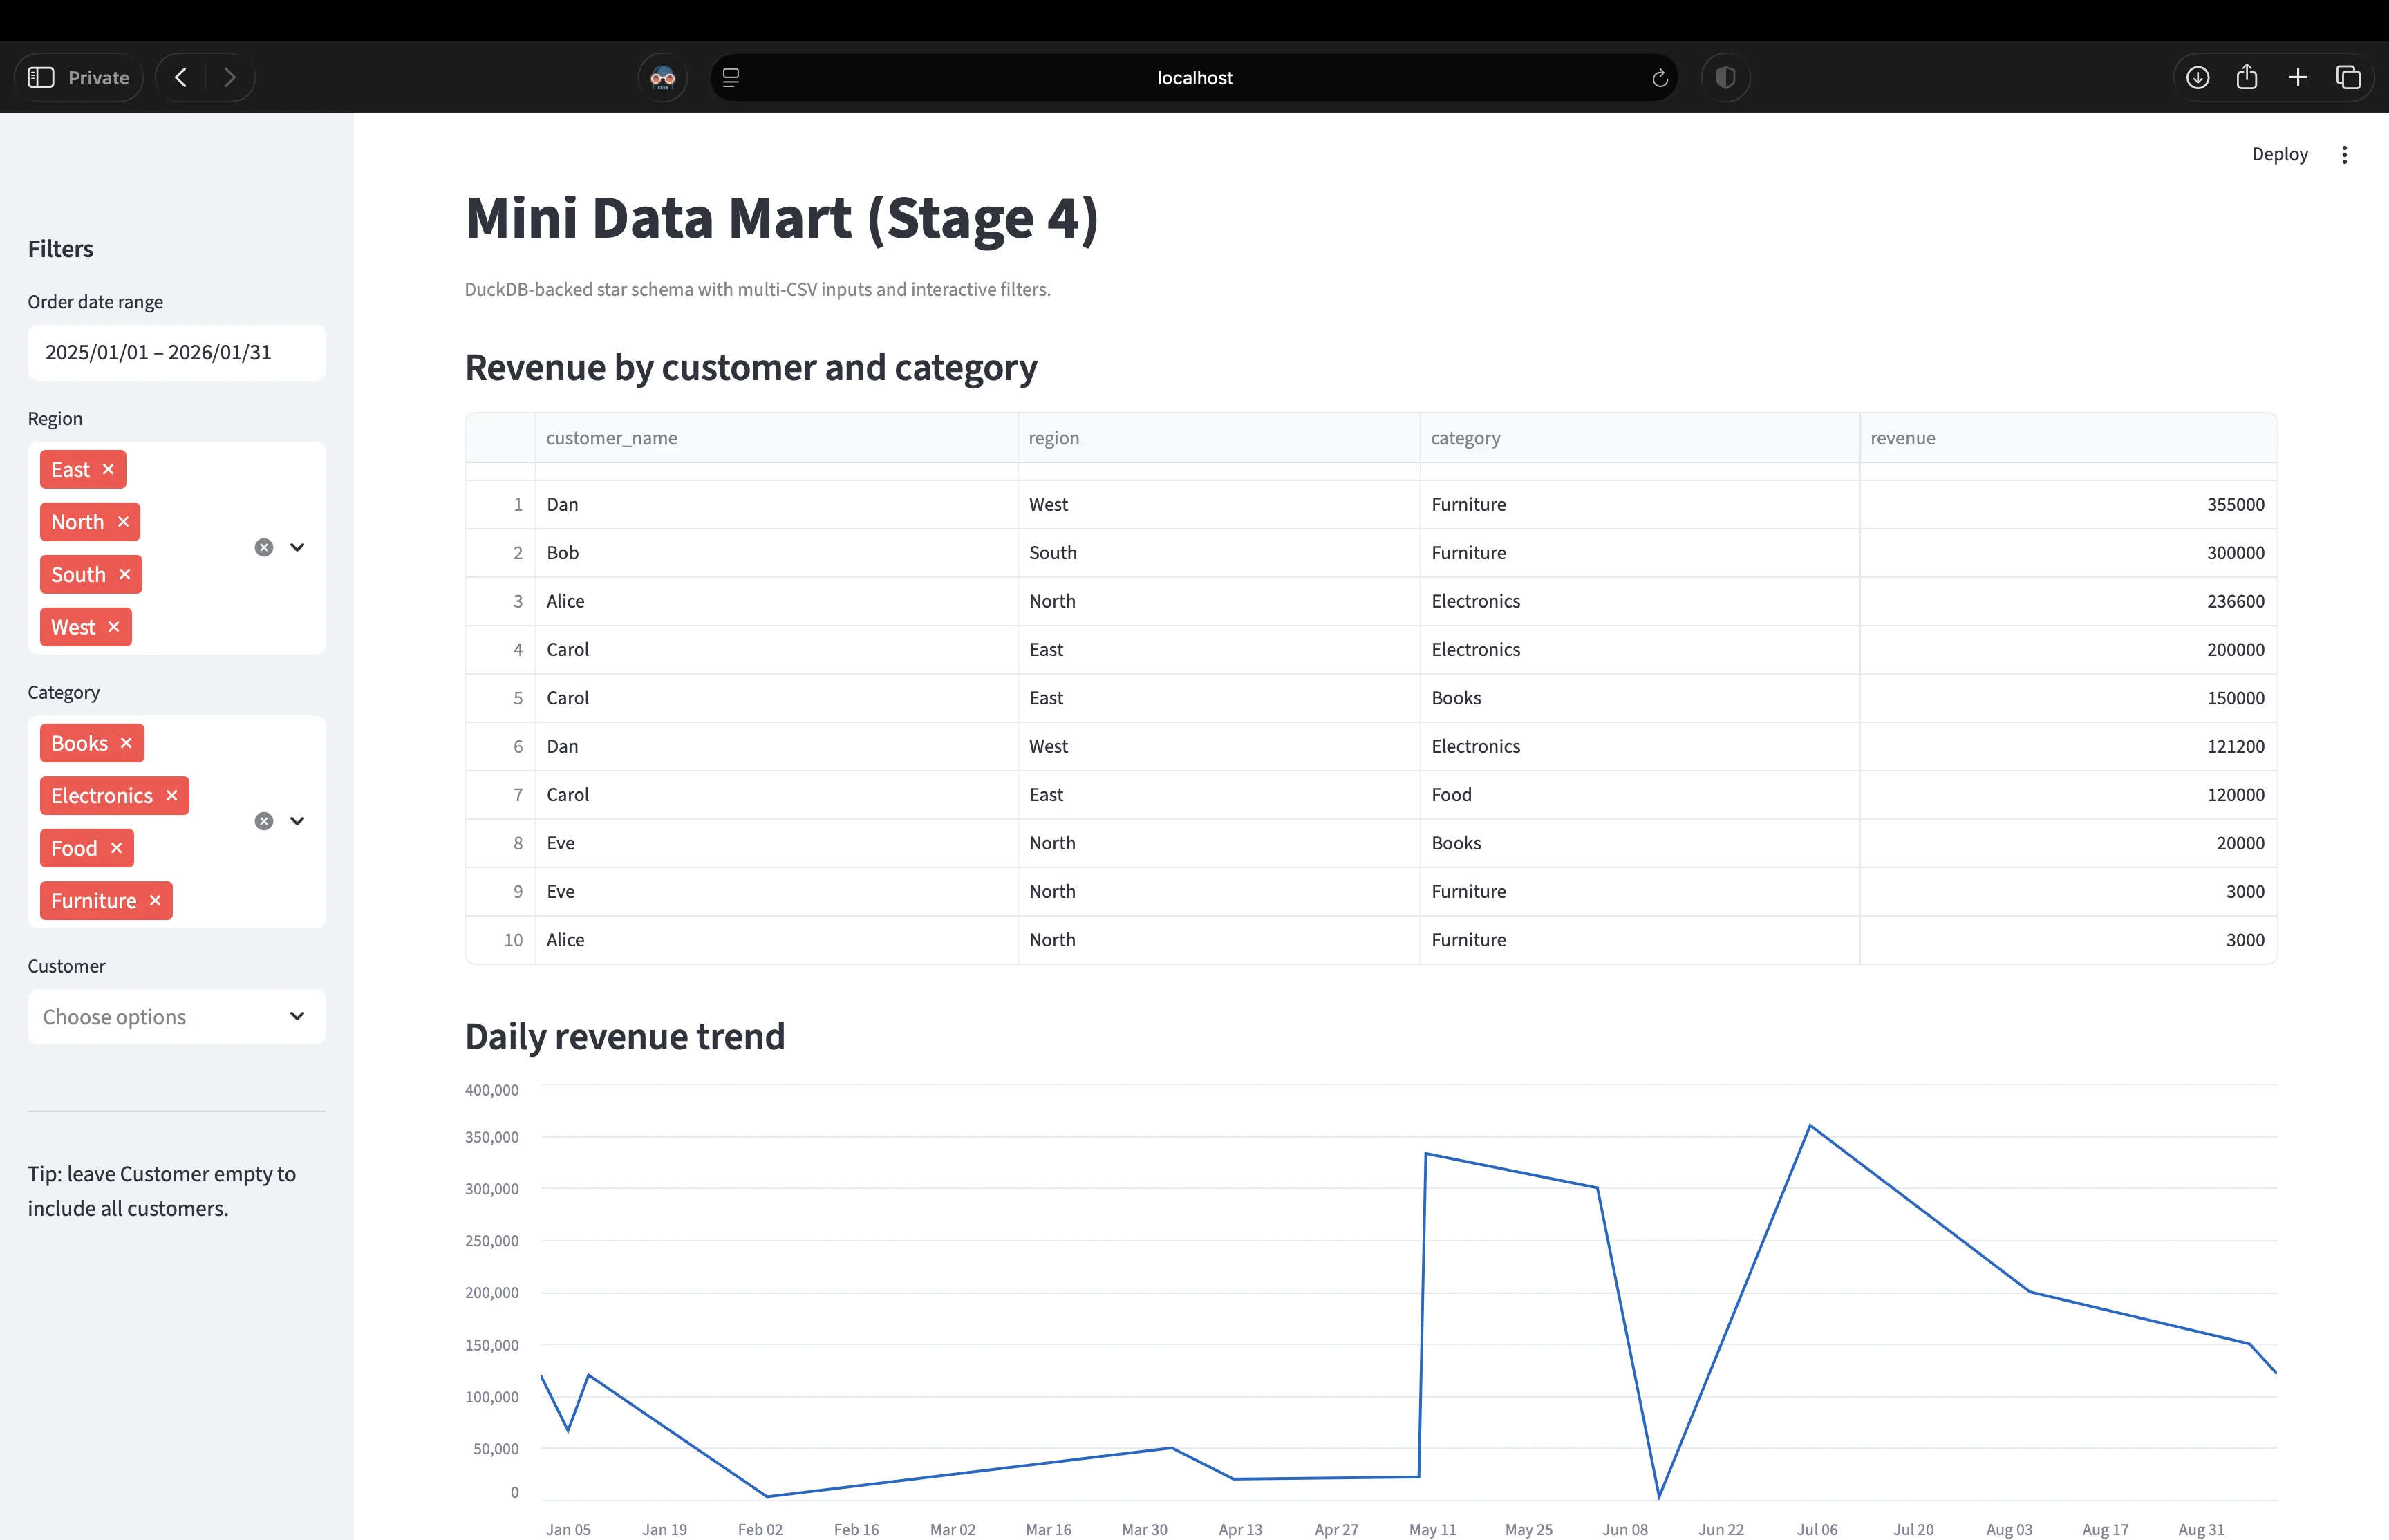
python -m mart) — build, explore, quality checks (nulls + referential integrity), and export. - Stage 4: Multi-CSV inputs (separate dimension files) plus an optional Streamlit dashboard and Tkinter desktop UI over the mart.
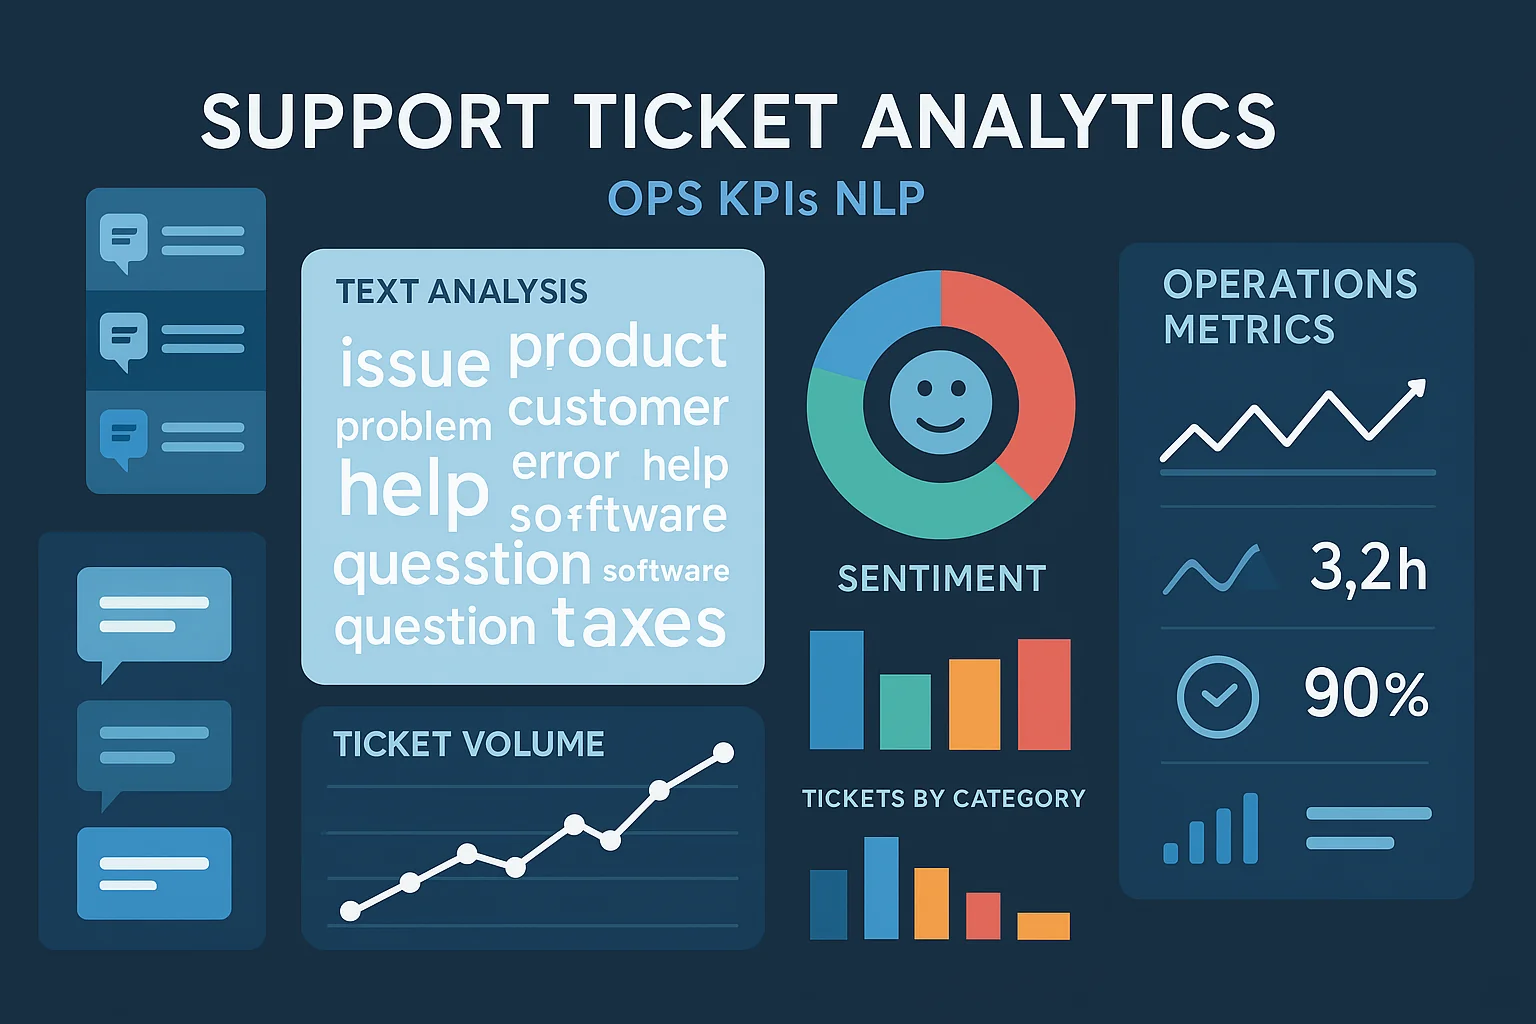
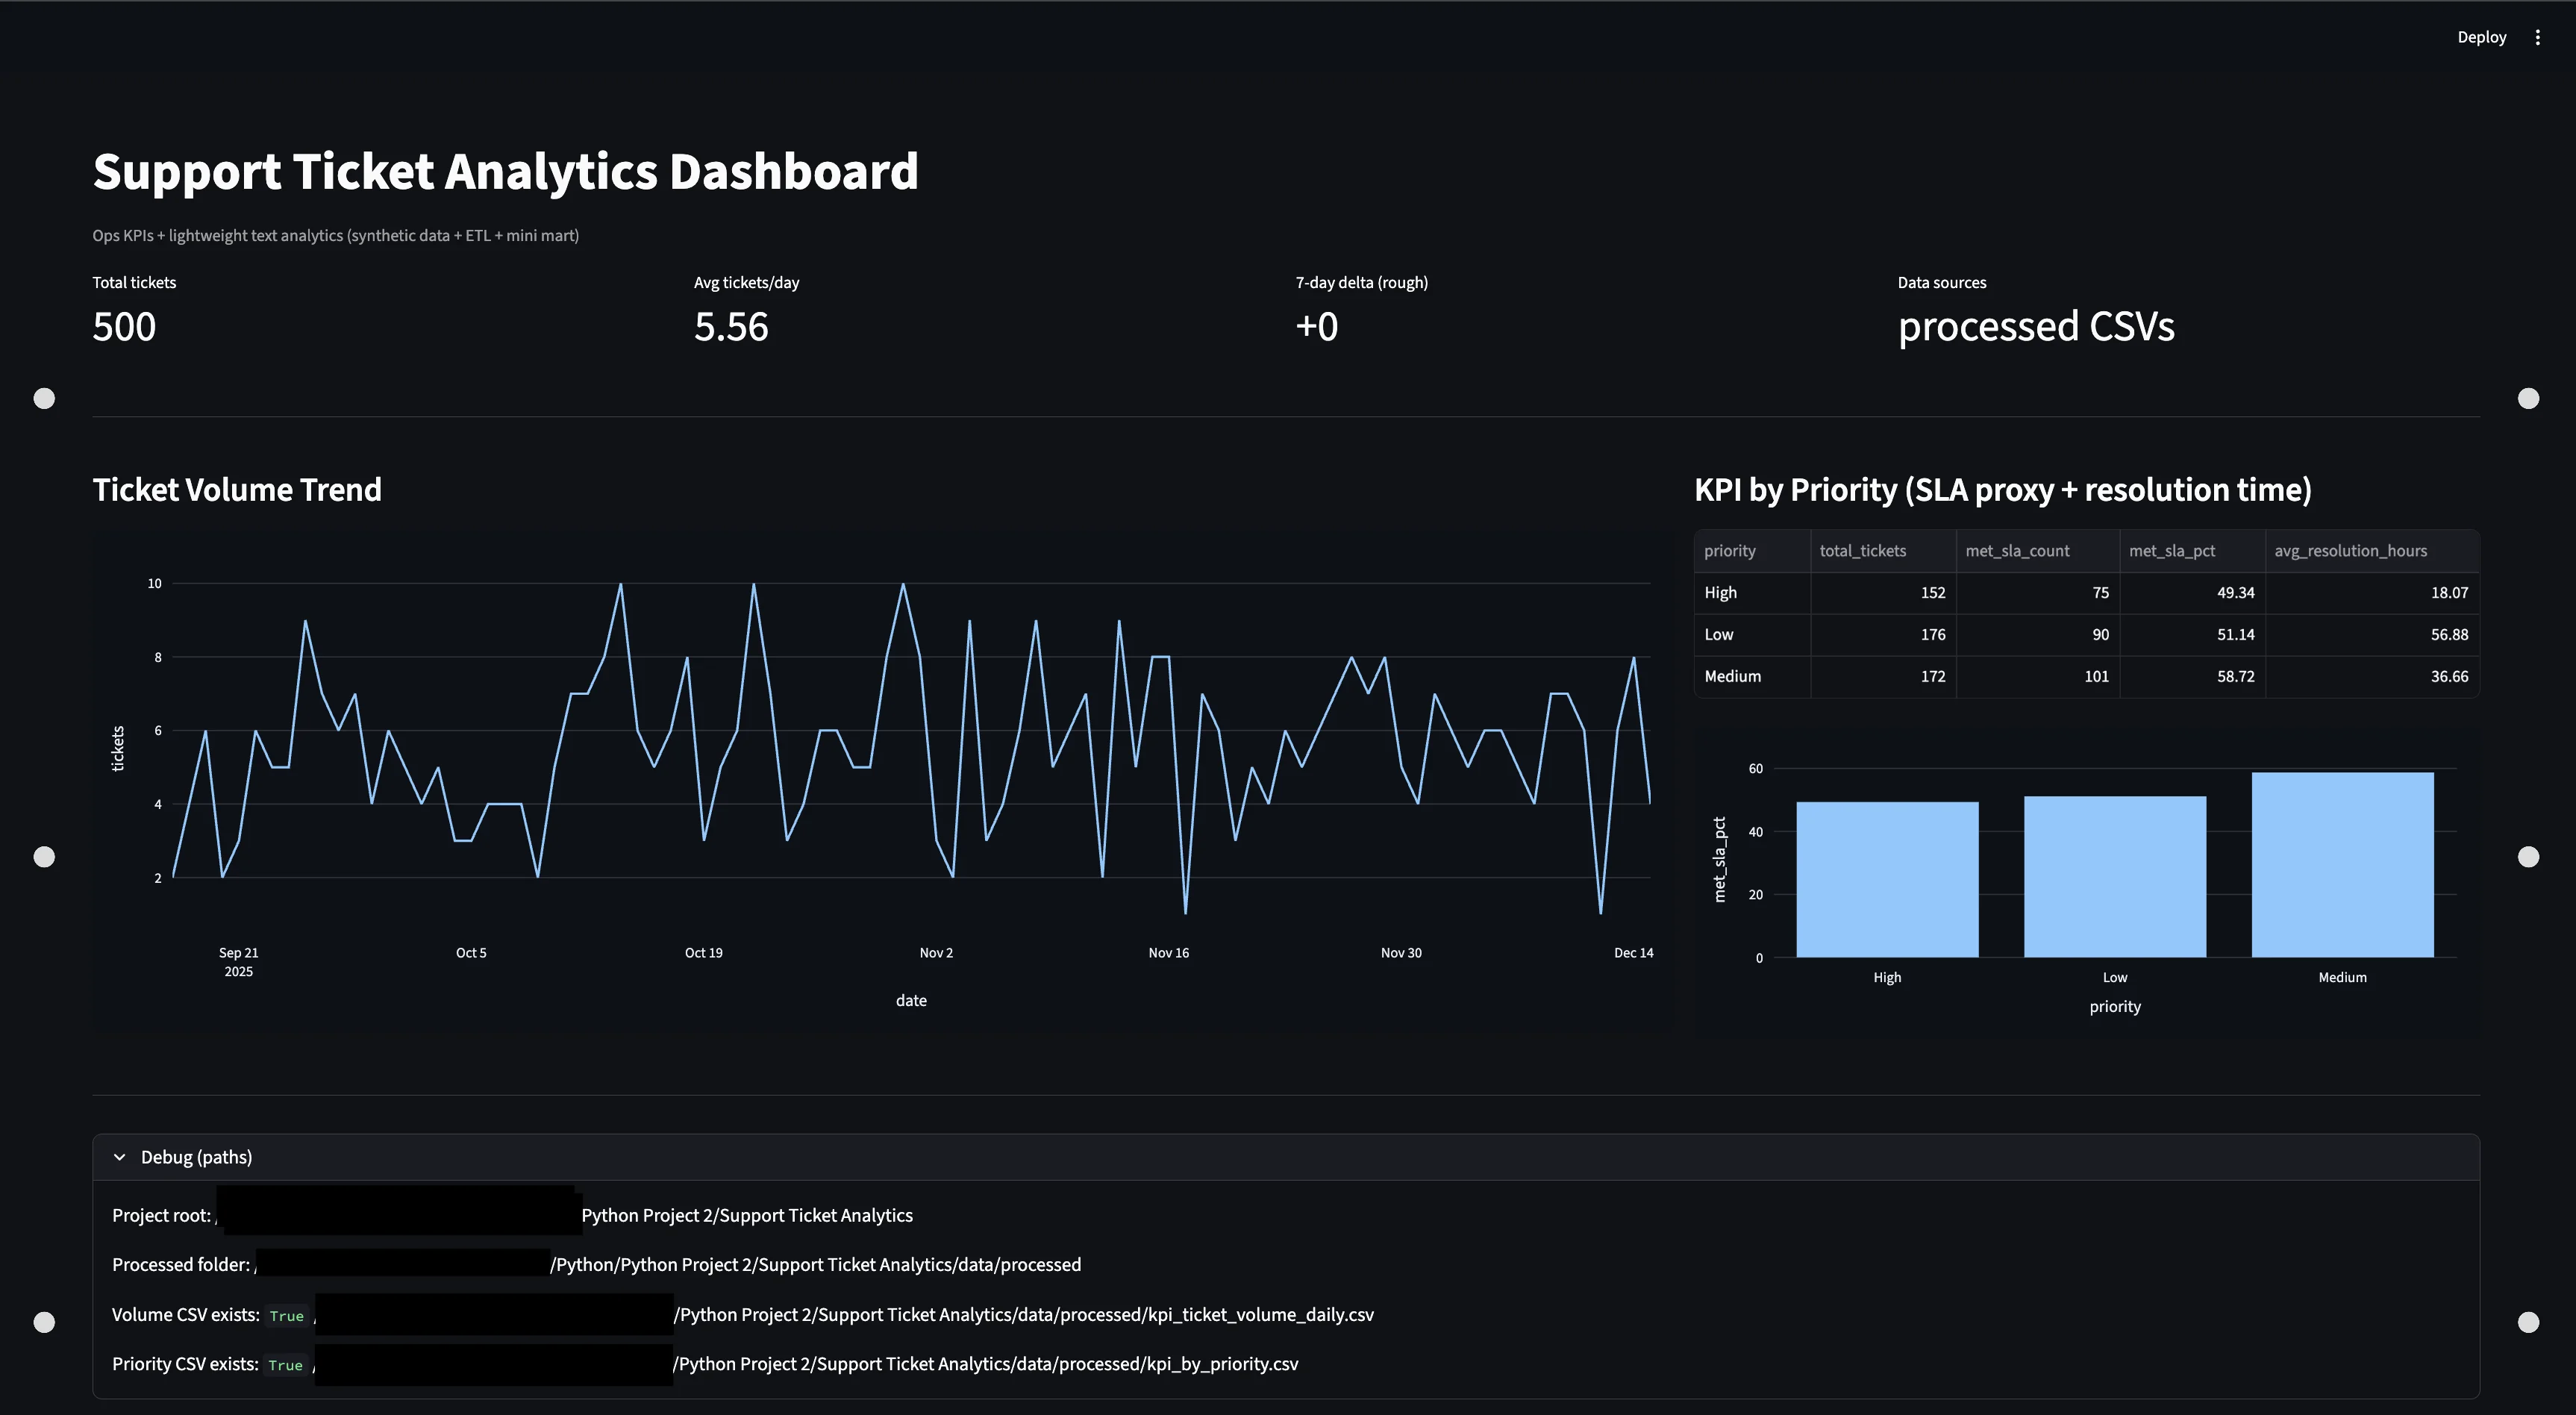
Support Ticket Analytics (Ops KPIs + NLP)
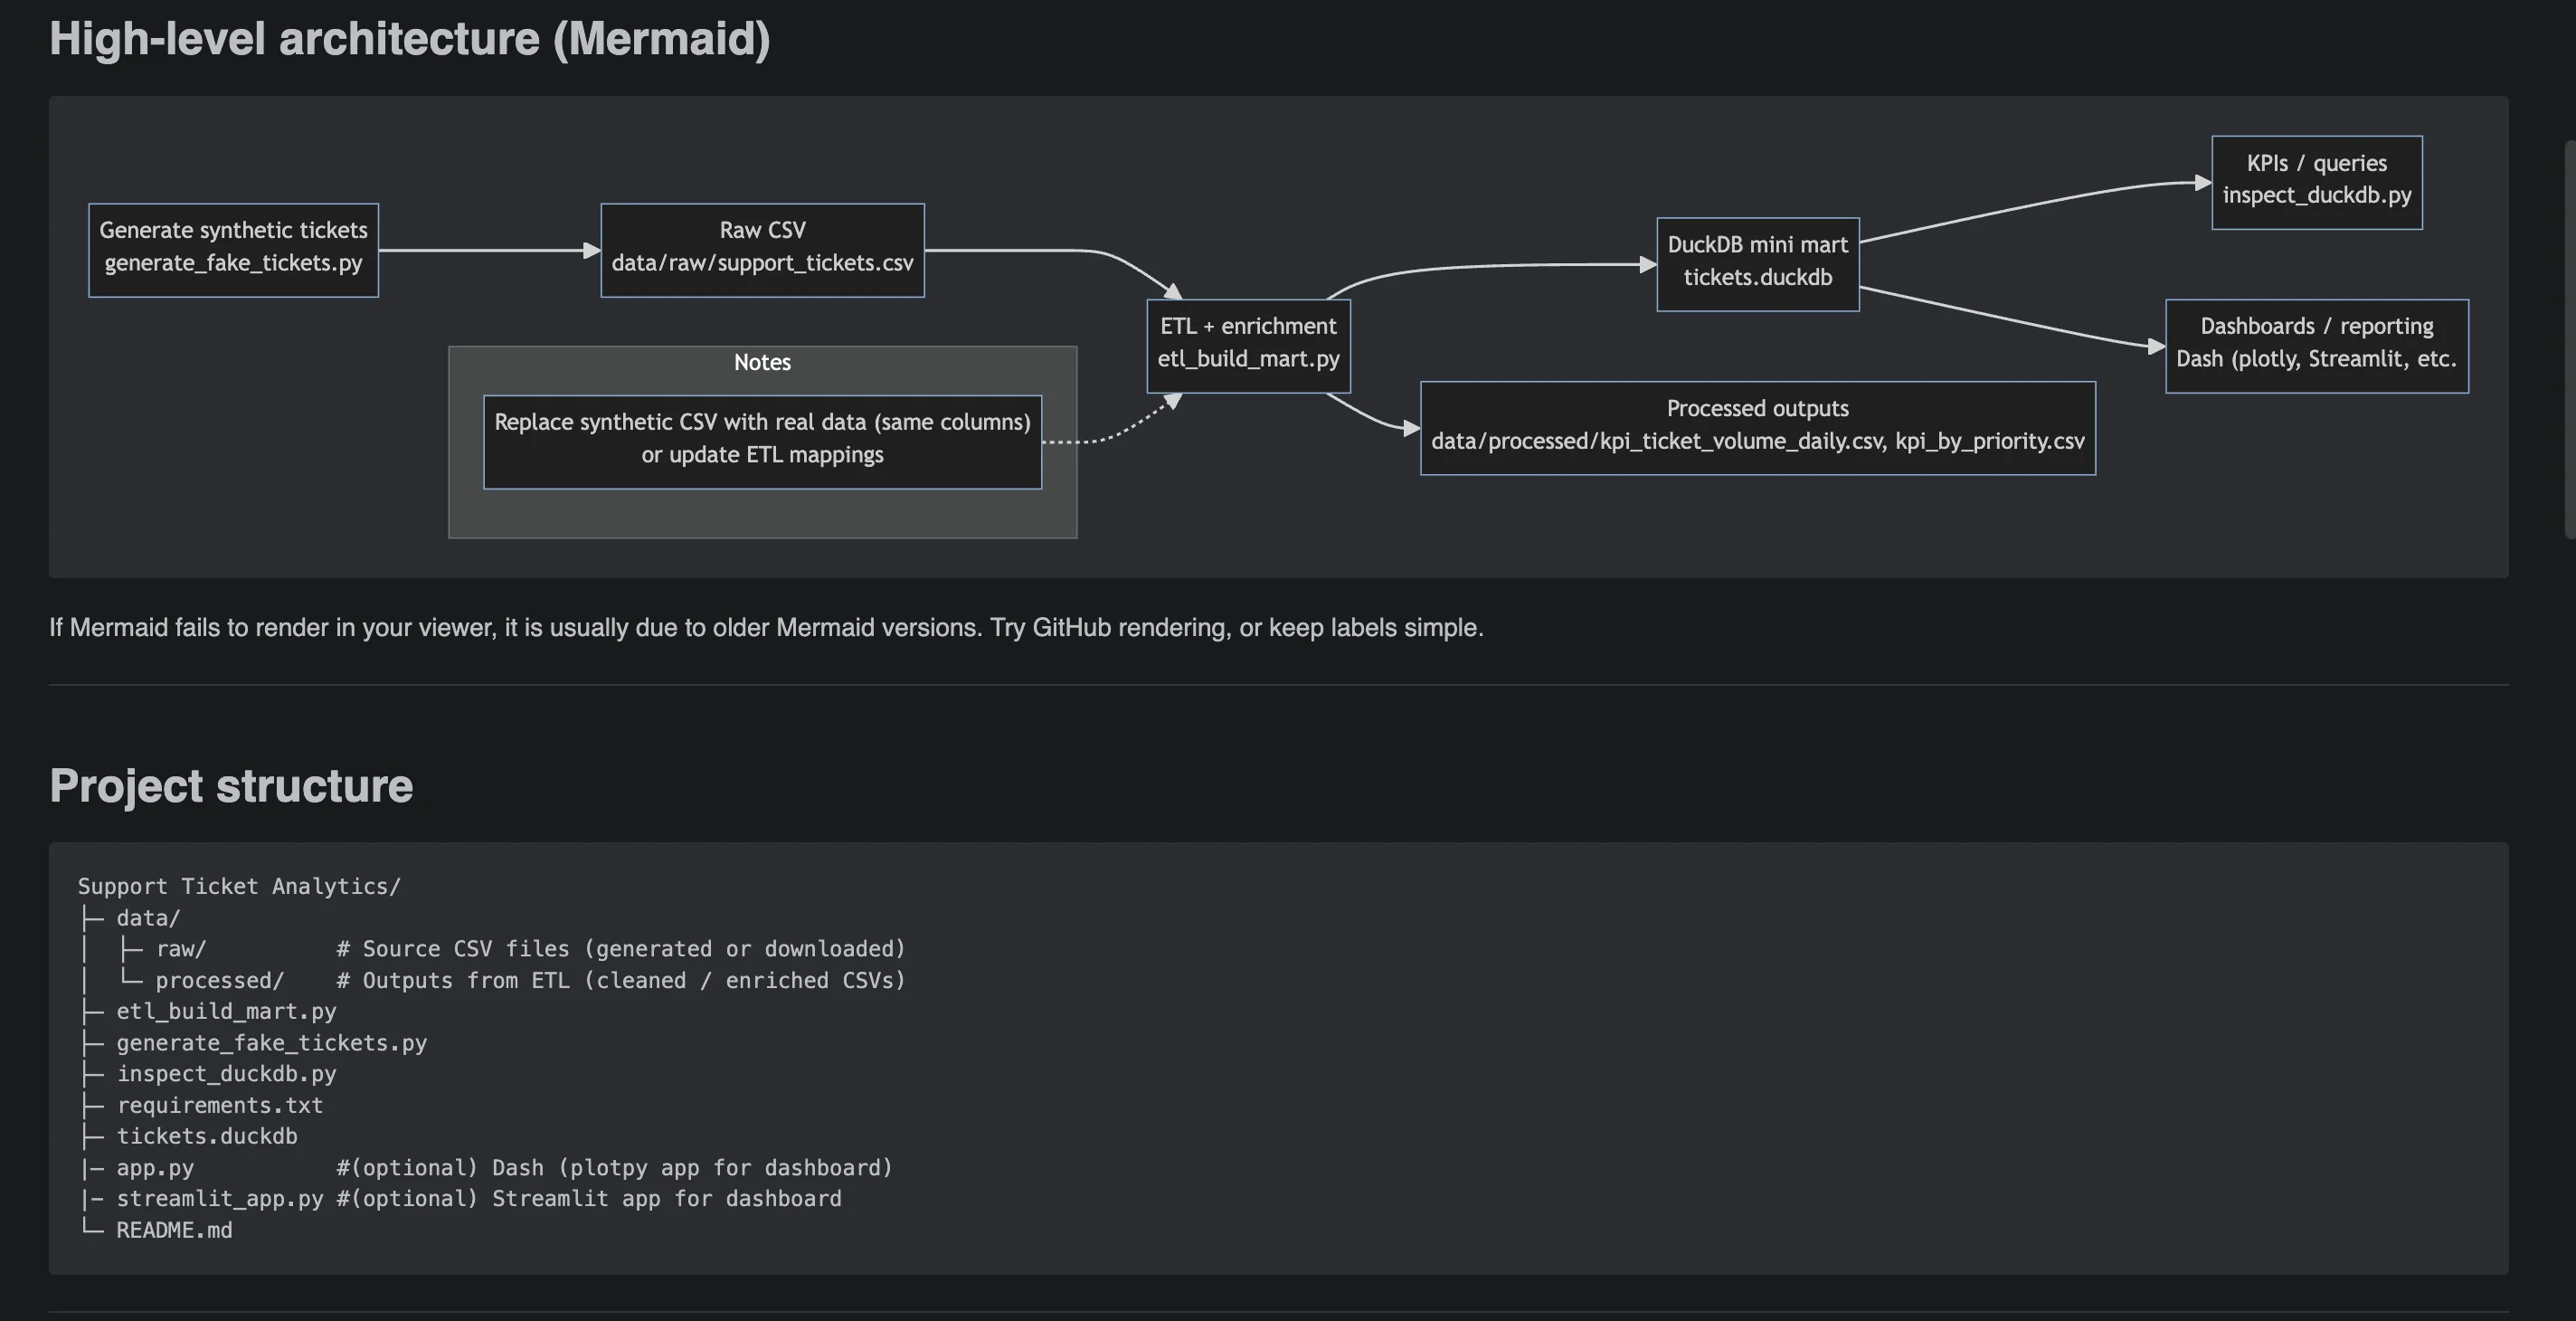
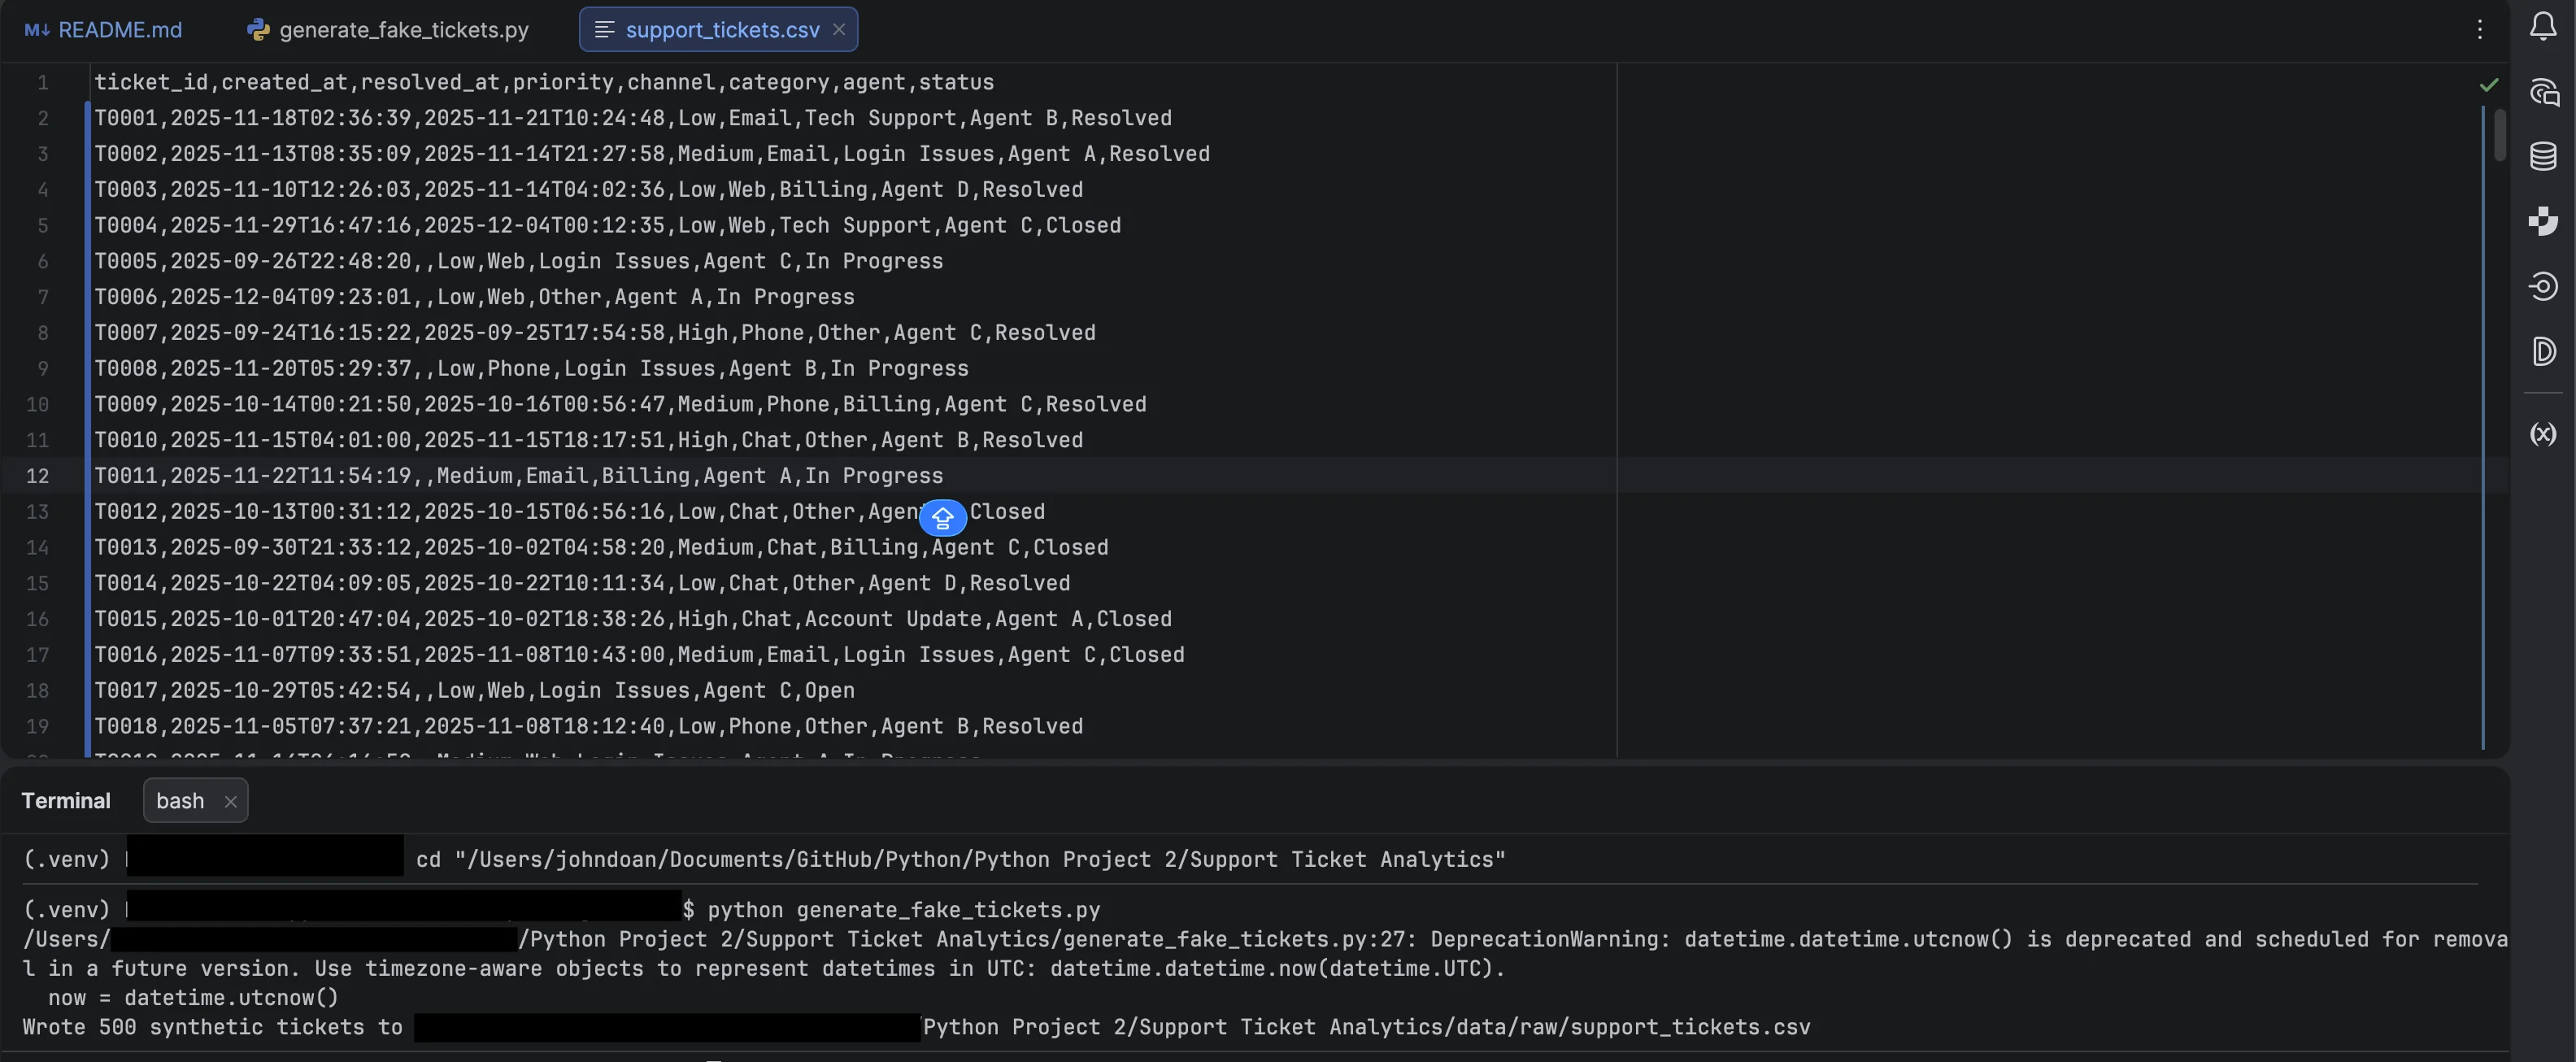
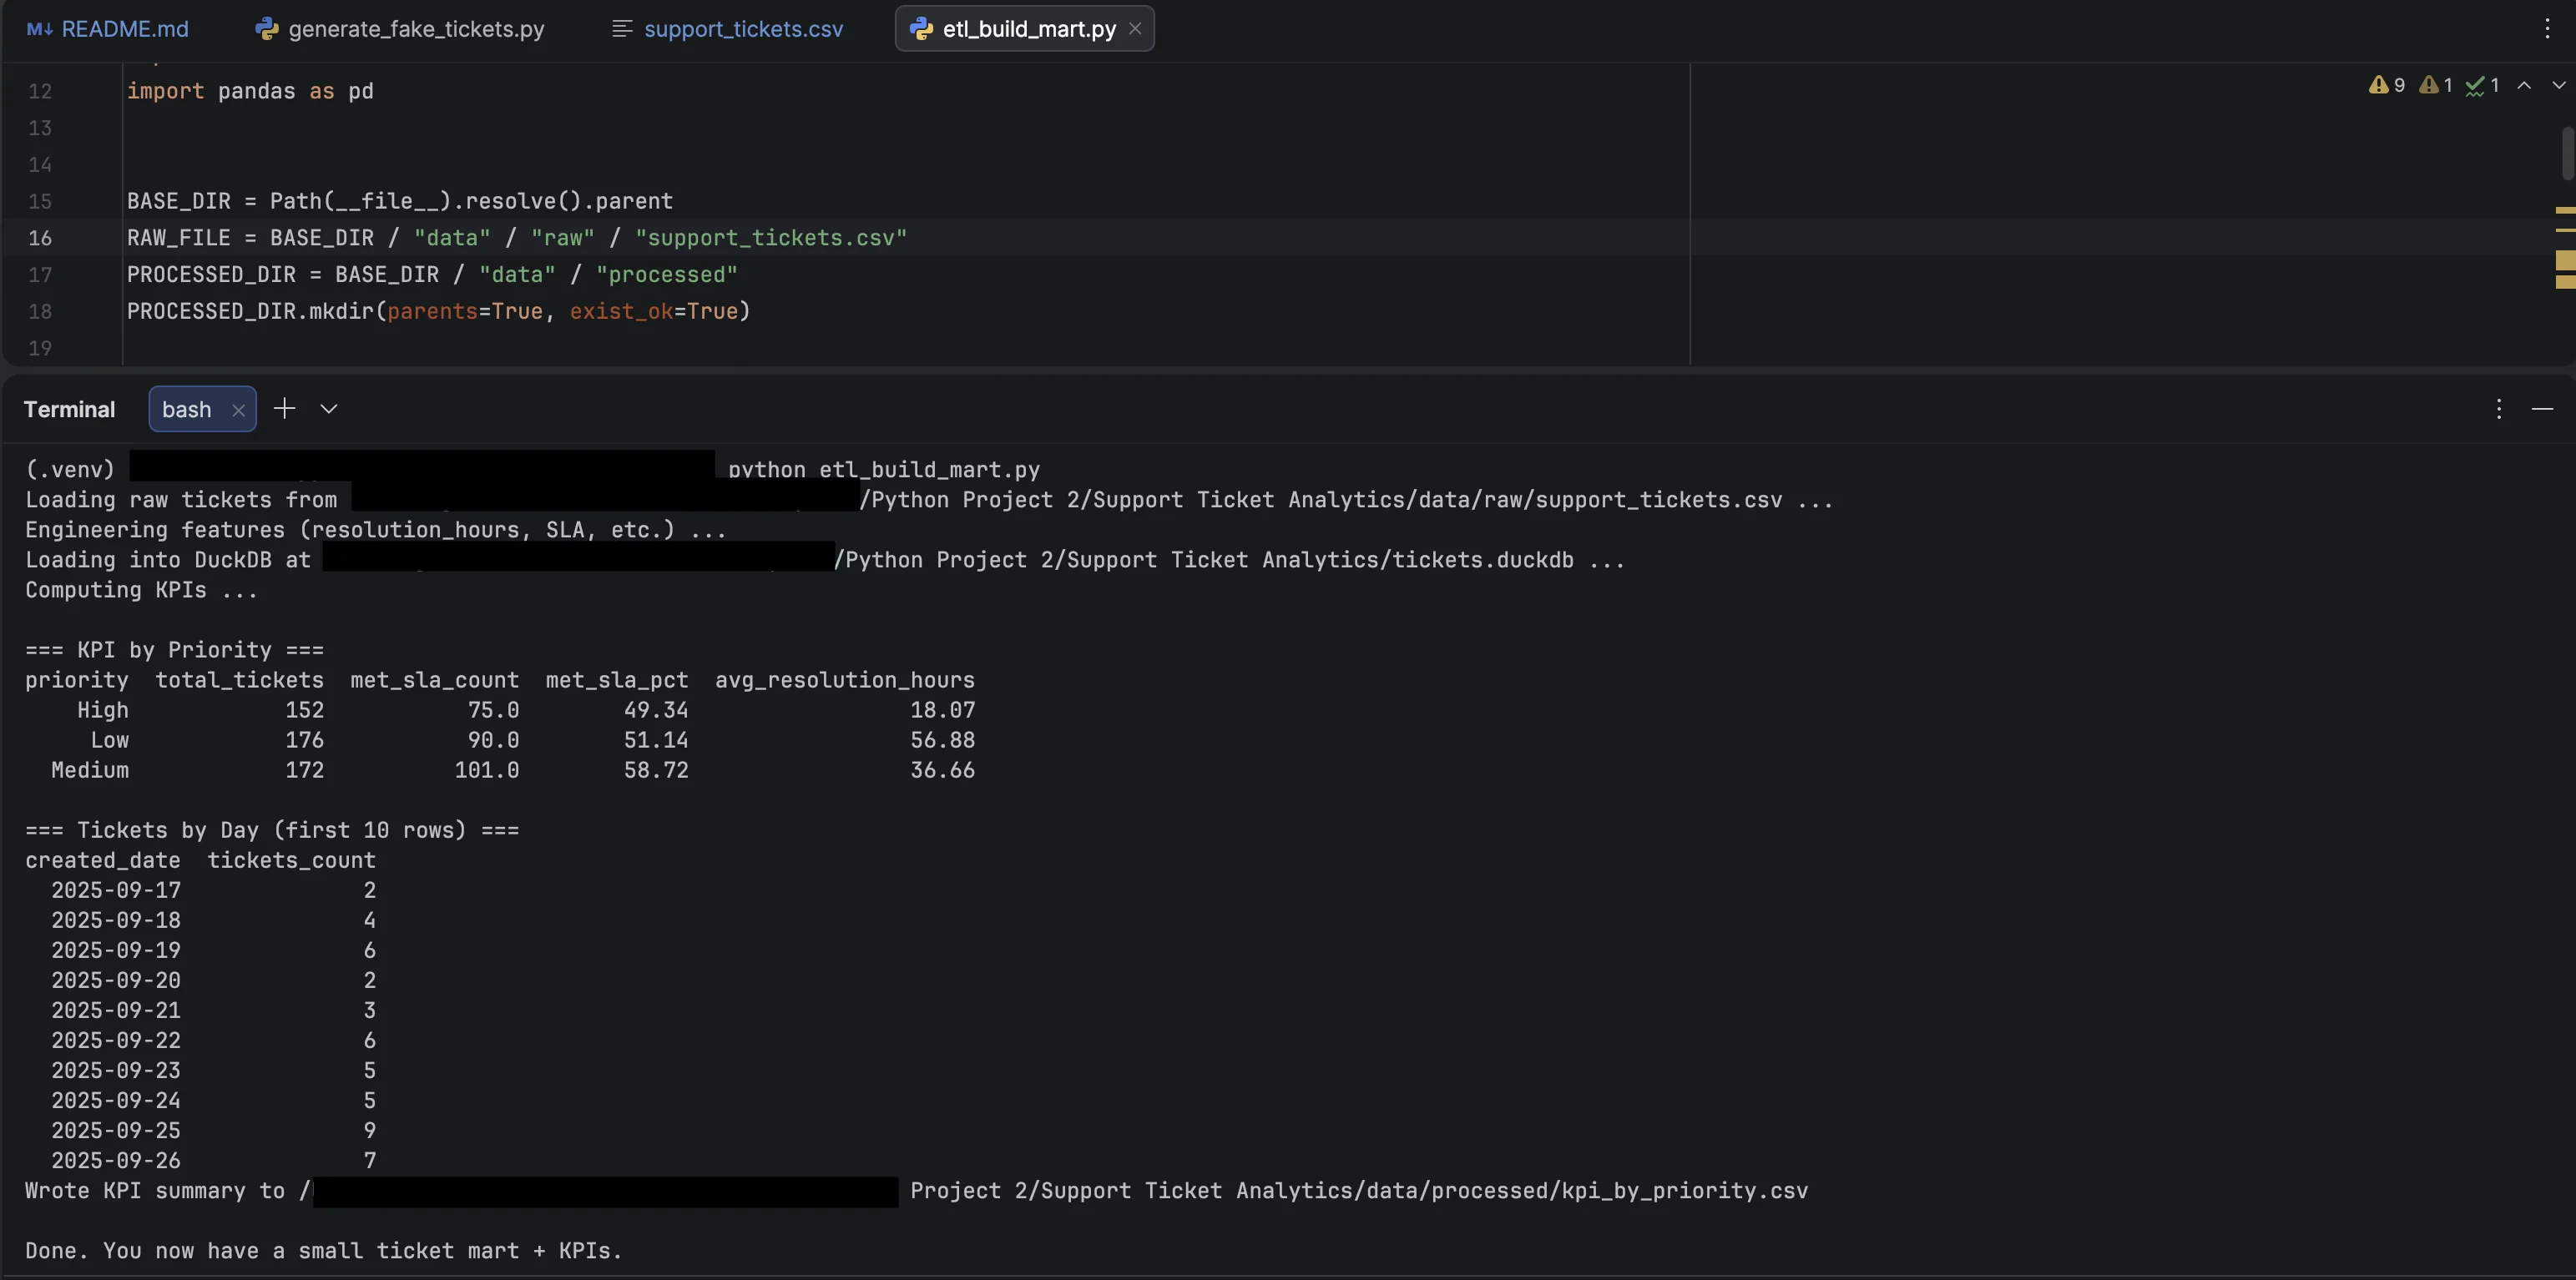
End-to-end analysis of support tickets: data prep, backlog/SLA proxy KPIs, lightweight text signals, and trend dashboards. Includes a synthetic generator + ETL build script.